 pool ads
A Direct Beneficiary of Volatility in the S&P 500
Natural trading Tools are starting to work again. The Market has not had anything close to natural conditions for years, volatility levels have been extremely low, but significant liquidity changes have taken place. The Market is getting back to normal, and with that natural trading tools are starting to work again too, for the first time in years.
Fibonacci Calculations are an excellent example. It started when the market fell from all time highs. The Market fell almost exactly to T1 support as identified by Fibonacci Calculations.
Now, again, the Fibonacci calculator defined inflection almost exactly, but this time it was based on the lows and the identification was resistance. Using the same approach as we did when we were looking for support levels, we identified the recent lows of the S&P 500 to be 2593.
We’ll Explain How it Works:
With that simple ultimate low identification, 2593, we turned to our Fibonacci Calculator and inputted that value into the LOW BOX and clicked calculate. The result showed 2691 as. T1 resistance.
Look at where the Market ended Tuesday’s session, it was an almost perfect test. This was almost exactly what happened when the Market fell from ultimate highs too, the 2873 range, to test T1 support perfectly then as well. So far the Fibonacci Pattern from the lows are the mirror image of the declines that happened before, but there was more to that previous pattern too.
The question is, will the same pattern continue to surface? If it is we can make money from it.
When the Market fell earlier, it fell to test T1 perfectly first, but then it blew through that level. So, if this time the Market has increased to test T1 resistance exactly, will it blow through that resistance level too, with momentum like the market had on the downside, and maintain its mirror image?
How can Fibonacci be used to protect assets and make money?
First, on the downside, after the ultimate high was identified and a small pullback had already begun, the T1 support line could have been identified well in advance, so we knew the downside risk. That gave us an opportunity to quantify the initial downside risk, and that provides us an opportunity to protect assets from declines proportional to the spread between those levels.
Recently, as the Market bounced back, we could have put 2593 into the low box and clicked calculate, and we would have had 2691 as the T1 target. That told us to be buyers. There was plenty of upside there, and the market closed right on this level when Tuesday was over.
So, Fibonacci can help you protect assets and make money, and it’s working again for the first time in years. The Market has lacked volatility, and trading tools need at least some volatility to work, and finally we have that.
Example:

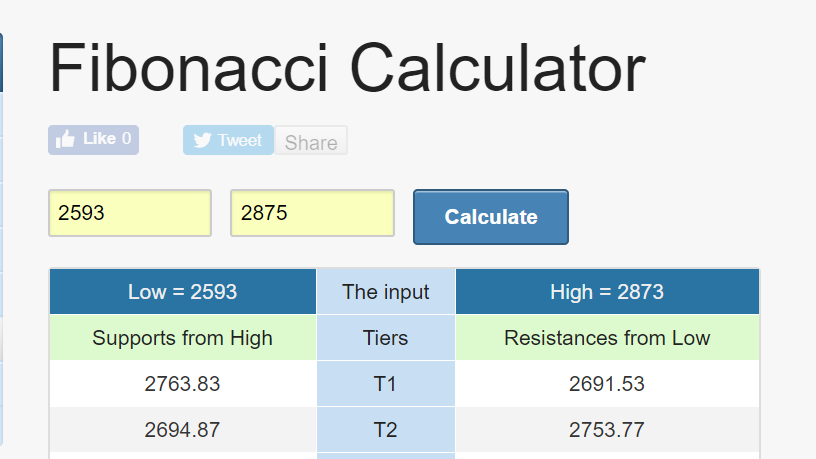
Above, you will find a snap shot of our Fibonacci calculator, with 2593 in the low box and 2875 in the high box. These are the book ends of the recent market moves. In this table you also will see very interesting similarities, and quite unique ones to boot.
First, the left side shows T values intended to represent inflection levels from the Highs, where the right side T values show inflection levels based on the recent lows.
In the table you will see almost exact values in the T1 and T2 cells, and that’s unusual. First, the T2 value in the left hand column and the T1 value in the right hand column are almost identical, while the T1 value in the left hand column and the T2 value in the right hand column are darn close as well.
Could this be telling us to expect the Market to stall near 2760?
Fibonacci observations, and other trading tools, are starting to show value again after a long drought. The lack of volatility was due to Central Banks and the fabricated demand they infused on a monthly basis, and finally that has virtually stopped. The markets are turning back to normal. That is allowing natural trading tools to work again.
Support and Resistance Plot Chart for SPY
Blue = Current Price
Red= Resistance
Green = Support
Real Time Updates for Repeat Institutional Readers:
Factset: Request User/Pass
Bloomberg, Reuters, Refinitiv, Zacks, or IB users: Access Here.
Our Market Crash Leading Indicator is Evitar Corte.
Evitar Corte warned of market crash risk four times since 2000.
It identified the Internet Debacle before it happened.
It identified the Credit Crisis before it happened.
It identified the Corona Crash too.
See what Evitar Corte is Saying Now.
Get Notified When our Ratings Change: Take a Trial