 pool ads
Ameren $AEE is Strong on a Near Term Basis, Shown in Charts and Graphs
Ameren (NYSE: AEE) is Strong on a Near Term Basis, Shown in Charts and Graphs below. Important: Please check the date of this report and update it as needed. The data changes over time.
Technical Summary
| Term → | Near | Mid | Long |
|---|---|---|---|
| Rating | Strong | Neutral | Neutral |
| P1 | 56.86 | 55.16 | 49.82 |
| P2 | 58.01 | 57.57 | 55.12 |
| P3 | 58.69 | 59.92 | 60.26 |
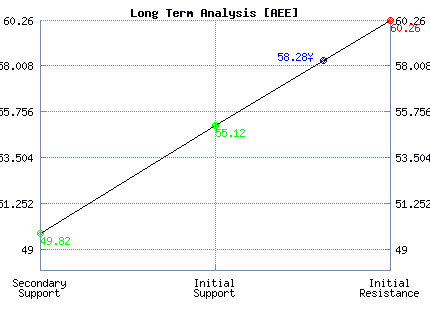
Support and Resistance Plot Chart for AEE
Long Term Trading Plans for AEE
June 21, 2018, 8:30 am ET
The technical Summary and associated Trading Plans for AEE listed below will help you make important timing decisions for your trades. This data is based on our proprietary analysis for AEE. In addition we offer Market Timing Models and Stock Filters in the links above which may increase the proficiency of the decisions you make.
AEE - (Long) Support Plan
Buy over 55.12 target 60.26 stop loss @ 54.86.
The technical summary data tells us to buy AEE near 55.12 with an upside target of 60.26. This data also tells us to set a stop loss @ 54.86 to protect against excessive loss in case the stock begins to move against the trade. 55.12 is the first level of support below 58.28 , and by rule, any test of support is a buy signal. In this case, support 55.12 is being tested, a buy signal would exist.
AEE - (Short) Resistance Plan
Short under 60.26 target 55.12 stop loss @ 60.52
The technical summary data is suggesting a short of AEE as it gets near 60.26 with a downside target of 55.12. We should have a stop loss in place at 60.52 though. 60.26 is the first level of resistance above 58.28, and by rule, any test of resistance is a short signal. In this case, if resistance 60.26 is being tested, a short signal would exist.


Blue = Current Price
Red= Resistance
Green = Support
Real Time Updates for Repeat Institutional Readers:
Factset: Request User/Pass
Bloomberg, Reuters, Refinitiv, Zacks, or IB users: Access Here.
Our Market Crash Leading Indicator is Evitar Corte.
Evitar Corte warned of market crash risk four times since 2000.
It identified the Internet Debacle before it happened.
It identified the Credit Crisis before it happened.
It identified the Corona Crash too.
See what Evitar Corte is Saying Now.
Get Notified When our Ratings Change: Take a Trial