 pool ads
An Inverted and Embedded Head and Shoulders Pattern
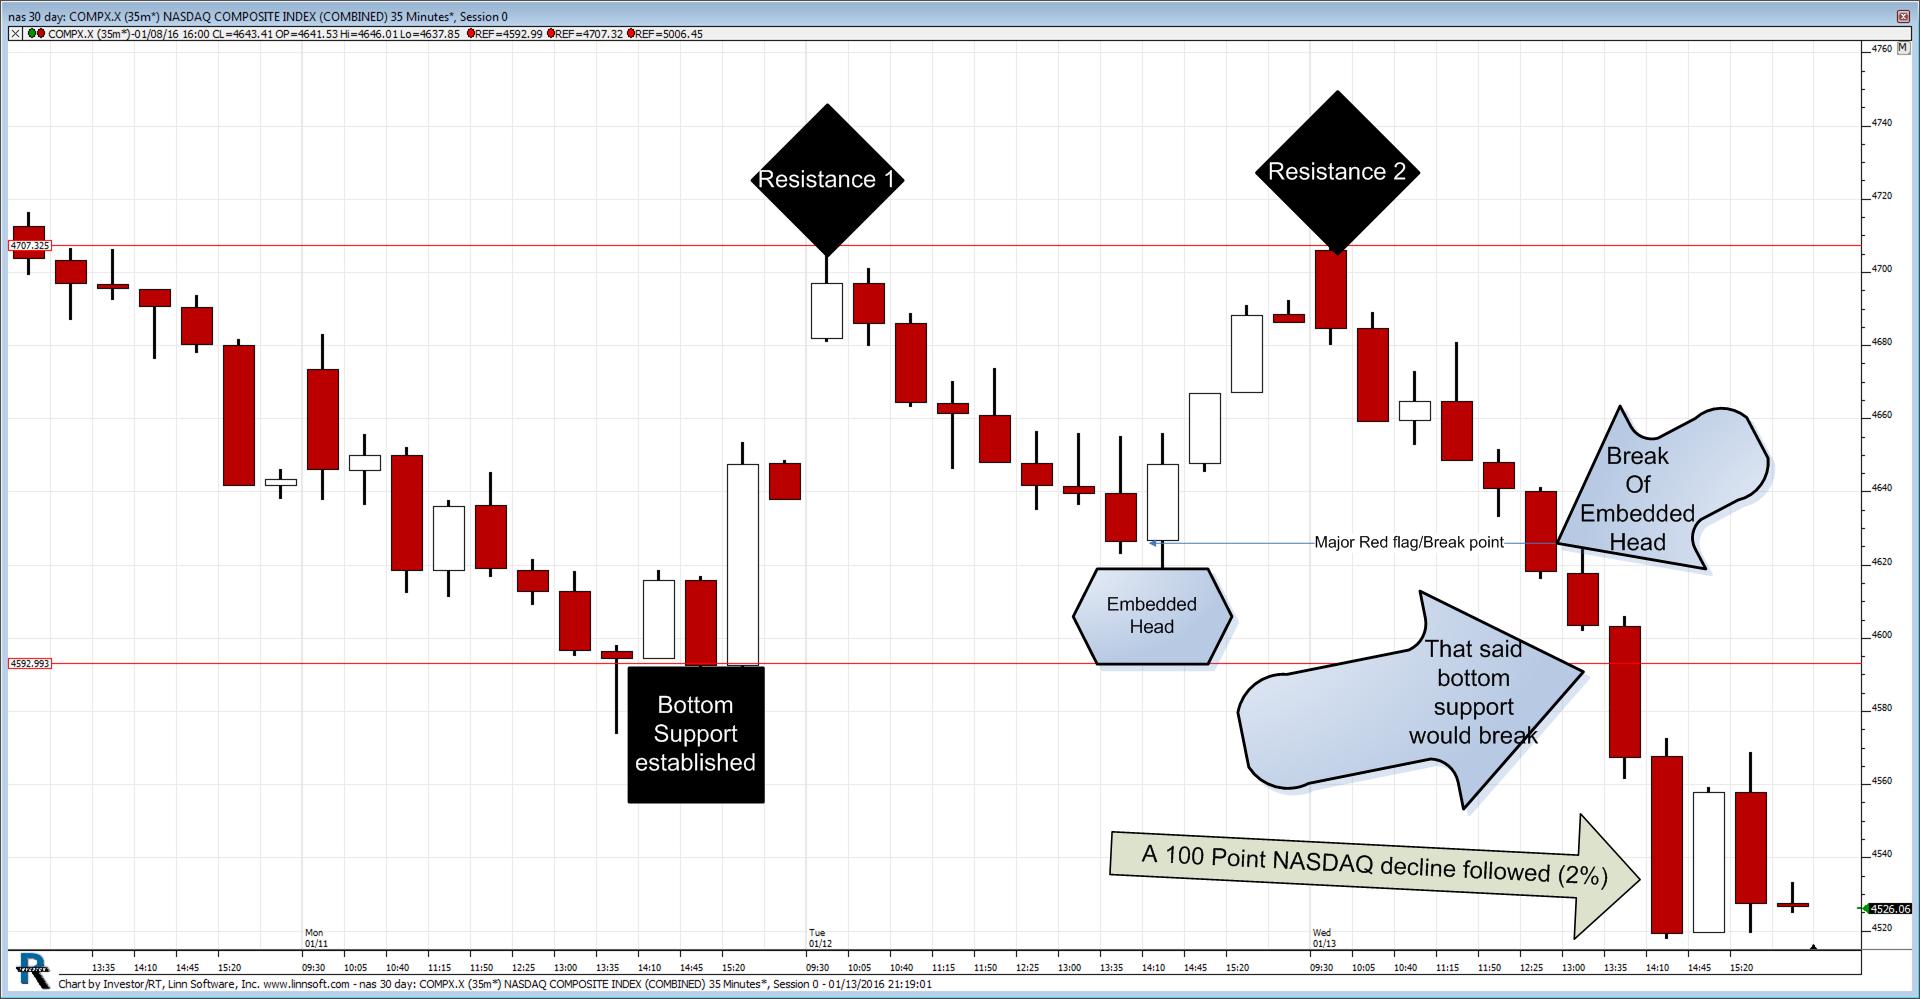
On Wednesday, January 13 something very interesting happened and I think it warrants our attention, if for no other reason than to be able to astutely identify this pattern in the future.
Yesterday, I described this pattern as an inverse head and shoulders formation, and I received some flak for that because it is not perfect, and the head that I identified is also embedded, but the pattern is significant because I find it to appear regularly in haphazard markets, like the one we have now and the one that I expect to continue, so we should have this in our wheelhouse and use it to make money.
I will describe this pattern in stages, and you'll see that the signal that suggested momentum driven market declines came early enough for us to capture as much as 2% of the downside market move that followed, which equates to 4% using market based ETFs like QID, TWM, SDS, and DXD.
There are six stages to this pattern.
- The market identified a bottom support level late in the day on Monday.
- The first resistance level was identified early in the day on Tuesday.
- The market declined to establish an embedded head
- The resistance level was tested a second time early in the day on Wednesday.
- The market fell and broke the level that defined the embedded head.
- That told us that the market would likely break the bottom support level as well.

The development of this pattern in real time initially looked like it could be potentially positive, but that changed. The reason why this looked initially like a positive pattern was because the embedded head was actually a higher low than the bottom support level that was established late in the day on Monday.
The second test of the resistance level established a neutral resistance line.
Reasonably, that was the first red flag, and it suggested that the market can fall back to the level parallel with the embedded head, and establish a neutral channel. If that happened it would have simply suggested that we move back to resistance again, so at this stage the potential positive tones had reverted to neutral, but it did not stop there.
Before I continue, it is important to recognize that positive trading channels almost never switch to bearish channels without first turning neutral, so the conversion to neutral when the market was pulling back from the second test of resistance towards the embedded head was normal.
However, when the market broke the level defined by the embedded head major red flags surfaced, and much more bearish undertones were revealed. It is that break that told us that the market would not only decline to the support level that was identified on Monday, but that it could break right through that and establish a new low, and it did.
The first red flag was clearly the second test of resistance, but that only identified a neutral tone. It was the break of the level defined by the embedded head that actually caused bearish tones to surface more meaningfully, and it is those that were immediately actionable.
Anyone who was respecting what the market said when the threshold identified by the embedded head was broken could have realized a 2% gain from the downside move in the market, which the quakes to a 4% gain using the leveraged ETFs that we prefer to trade.
My experience has told me that patterns like this present themselves on both sides of the fence quite often in haphazard market environments like the one we have right now and like the one we will continue to have, most likely, throughout this calendar year.
I continue to believe that the odds of a market crash are high, and I continue to focus on short term trading strategies not unlike the short-term opportunity that this particular trading pattern provided.
Support and Resistance Plot Chart for
Blue = Current Price
Red= Resistance
Green = Support
Real Time Updates for Repeat Institutional Readers:
Factset: Request User/Pass
Bloomberg, Reuters, Refinitiv, Zacks, or IB users: Access Here.
Our Market Crash Leading Indicator is Evitar Corte.
Evitar Corte warned of market crash risk four times since 2000.
It identified the Internet Debacle before it happened.
It identified the Credit Crisis before it happened.
It identified the Corona Crash too.
See what Evitar Corte is Saying Now.
Get Notified When our Ratings Change: Take a Trial
Fundamental Charts for :