 pool ads
Cisco Systems, Inc. (NASDAQ:CSCO) Looks Rich
When high growth companies turn into slow growth companies investors in those stocks often become disgruntled and demand to see more meaningful growth from the company even when the industry does not necessarily support that growth. Stocks like this may remain depressed until such time as a glimmer of hope surfaces, but sometimes the stock's reaction to that glimmer of hope is not warranted.

Cisco Systems, Inc. (NASDAQ:CSCO) trades with a multiple higher than at any time since the beginning of 2010, yet earnings growth looks awful. Something has to give.
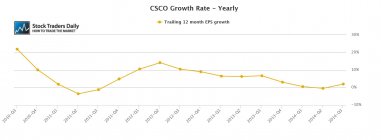
Our analysis of earnings focuses on trailing 12 month EPS for every quarter, we exclude 1-time events to focus on growth from operations, and we compare that Y/Y to get yearly growth data on a quarterly basis. By plotting that over time we can see how yearly growth has changed over time in graphical format. In the chart below we can see that Q2 2014 actually saw negative EPS growth, while Q3 2014 delivered a whopping 1.97% growth rate.
At the same time the P/E multiple is 13.4, which is higher than at any point since Q3 2010, and that is a surprise given the slope of the EPS growth rate.
However, if CSCO delivers on what is has suggested it would in the next EPS report it should improve EPS growth to about 4.5%. This has not happened yet, and still is not a robust growth rate, and it still makes the P/E multiple look stretched, but it would surely be better than 1.97%!
Technical take:
According to our real time trading report for Cisco (CSCO Trading Report) the stock has not yet tested longer term resistance but it certainly came close and it still could test longer term resistance officially. Because CSCO is so close to longer term resistance, especially when compared to the difference between the current price and support, our report is not suggesting any buys, however. CSCO is an avoid for the time being, and may be a short if resistance levels are tested.
Summary:
On a fundamental basis we do not like the EPS growth rate, even forward looking the growth rate does not seem to lineup with the PE multiple, and the multiple is the highest it has been for years while EPS growth is languishing. The stock seems to be a better short, but not immediately. If CSCO tests longer term resistance, a level that will change slightly over time, we would be willing short sellers.
Disclaimer:
Stock Traders Daily provides trading strategies, which by definition incorporate risk controls, and it has only engaged in buy and hold strategies twice since the turn of the century. The first was in October of 2002, and those buy and hold strategies lasted until 2006, and the second was in February of 2009, and those buy and hold strategies lasted until the end of 2010. Every point in between Stock Traders Daily has been providing risk controlled strategies, market based strategies, and strategies for approximately 3000 individual stocks, which are unbiased and which incorporate the notion that short term gains lead to long term success. There is a time and a place for buy and hold strategies and this is neither the time nor the place for that approach in our opinion. Risk controls are essential.
Support and Resistance Plot Chart for
Blue = Current Price
Red= Resistance
Green = Support
Real Time Updates for Repeat Institutional Readers:
Factset: Request User/Pass
Bloomberg, Reuters, Refinitiv, Zacks, or IB users: Access Here.
Our Market Crash Leading Indicator is Evitar Corte.
Evitar Corte warned of market crash risk four times since 2000.
It identified the Internet Debacle before it happened.
It identified the Credit Crisis before it happened.
It identified the Corona Crash too.
See what Evitar Corte is Saying Now.
Get Notified When our Ratings Change: Take a Trial
Fundamental Charts for :