Predictive AI
Adds Alpha, Reduces Beta, Controls Risk
Comps are Easy for Target Corporation (NYSE:TGT)
Target Corporation (NYSE:TGT) has been selected as the Stock of the Week by Stock Traders Daily for the week ending April 10 and specific entry levels have been recommended accordingly.
The Stock of the Week is a Strategy developed by Thomas H. Kee Jr. to enable individual investors to achieve better than market performance over time with integrated risk controls. This Strategy began in December, 2007, so it is already proven in a down market, and many consider this to be the best performing strategy on the market since that time.
Part of the basis for this selection was the fundamental analysis we have conducted for TGT and have provided below.
Ours is an earnings based analysis that focuses on EPS growth rates as those are compared to PE multiplies over time, and extending 2 years out as well in observance of forward looking analysts estimates to gauge future fair value as well. We exclude 1-time events and include complete earnings cycles to better define EPS growth as well.
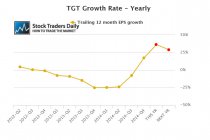
EPS growth has been negative for TGT since Q$2012, until the last quarter. EPS growth was 17.33% last quarter and is expected to be 36.4% for calendar 2015 after the year is done, and grow again by 28.9% in 2016 by the end of that year if analysts are correct. 2015 and 2016 EPG growth estimates are represented by the first and second red dots in our EPS growth chart.
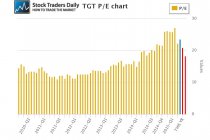
The PE multiple for TGT is high compared to historical measures but is also expected to improve. Interestingly, the multiple started to increase meaningfully at about the same time as EPS deterioration began, it peaked at 27.15 in February, but the current PE, the blue bar in our graph, is 23.49. The first and second red bars represent 2015 and 2016 if analysts are right and price remains the same, and they are 20.88 and 28.21 respectively. That suggests improvement.
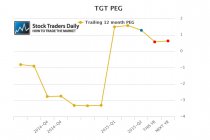
When we combined these to look at PEG ratios we get a better gauge of fair value. We consider fair value to exist when companies trade with a PEG ratio between 0 and 1.5 (in most cases). The current PEG ratio for TGT is 1.28 (blue dot) and if price remains the same and analysts are right PEG is likely to fall to 0.57 by the end of 2015 and to 0.63 at the end of 2016. That makes TGT look attractive right now on a fundamental basis.
However, the comps are very easy.
Prior to the last Earnings report TGT had about 6 quarters of very bad EPS numbers, and that makes it easy to put up solid growth rates based on Y/Y data. This may not present a valuation right now, but we expect the otherwise exceptional growth rates that appear now for TGT to come down measurably as earnings normalize and that means much slower growth than what we are seeing now. Multiple contractions may be appropriate then.
⚠Triggers may have already come
Support and Resistance Plot Chart for
Blue = Current Price
Red= Resistance
Green = Support
Real Time Updates for Repeat Institutional Readers:
Factset: Request User/Pass
Bloomberg, Reuters, Refinitiv, Zacks, or IB users: Access Here.
Our Market Crash Leading Indicator is Evitar Corte.
Evitar Corte warned of market crash risk four times since 2000.
It identified the Internet Debacle before it happened.
It identified the Credit Crisis before it happened.
It identified the Corona Crash too.
See what Evitar Corte is Saying Now.
Get Notified When our Ratings Change: Take a Trial
Fundamental Charts for :