Predictive AI
Adds Alpha, Reduces Beta, Controls Risk
Goldman Sachs Group Inc (NYSE:GS) Is Not Growing
The good news is that Goldman trades at almost 10x earnings (seemingly cheap), the bad news is that the company is not growing. The 75% institutional ownership and the low P/E multiple suggest that the investment community, although still appraise of Goldman as the Premier House of the Street, does not like the company's recent performance.
Goldman Sachs Group Inc (NYSE:GS) is scheduled to report earnings before the market opens on Wednesday and the street is looking for $3.05 per share from the company. If Goldman Sachs matches estimates it will be lower than the same quarter of the previous year, raising red flags for analysts across the board. What's more concerning, the overall growth trends for Goldman Sachs are now at zero, meaning that the company has not been growing.
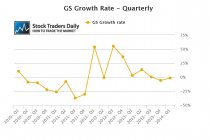
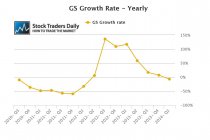
In the two charts below we demonstrate trailing 12 month growth rates first on a quarterly basis, then year over year. The quarterly chart compares trailing 12 month growth this quarter to the trailing 12 month growth rate from last quarter to see how the company has been growing quarter by quarter. The second chart compares the trailing 12 month growth rate this year to the trailing 12 month growth rate that existed at this same period last year to determine annual growth rates. In each case, Goldman Sachs is at zero.
The stock trades with a PE multiple slightly above 10 times earnings, but compared to other companies that are not growing, and there are plenty of them, Goldman Sachs does not look nearly as rich as those. However, a company trading at a multiple like this without any growth and with no immediate catalysts to spur growth is typically not heavily in favor by the financial community, so in order for Goldman Sachs to become in favor it will need to show us the money.
For traders, Goldman Sachs recently tested a level of longer-term resistance as that is identified in our real time trading report for GS, and by rule we should expect the stock to decline so long as resistance lines remain intact. Our target should be the level of longer term support as that is identified in our report. Resistance also acts as a risk control for any traders who short near resistance levels.
In summary, Goldman Sachs does not look nearly as rich as some other companies that have zero growth rates, but the multiple paid for Goldman Sachs today still may be in jeopardy.
⚠Triggers may have already come
Support and Resistance Plot Chart for
Blue = Current Price
Red= Resistance
Green = Support
Real Time Updates for Repeat Institutional Readers:
Factset: Request User/Pass
Bloomberg, Reuters, Refinitiv, Zacks, or IB users: Access Here.
Our Market Crash Leading Indicator is Evitar Corte.
Evitar Corte warned of market crash risk four times since 2000.
It identified the Internet Debacle before it happened.
It identified the Credit Crisis before it happened.
It identified the Corona Crash too.
See what Evitar Corte is Saying Now.
Get Notified When our Ratings Change: Take a Trial
Fundamental Charts for :