Home Depot Inc (NYSE:HD) started with a Sell Rating at Stock Traders Daily
Stock Traders Daily has initiated shares of Home Depot Inc (NYSE:HD) with a sell rating. This call has significant Macroeconomic undertones premised on The Investment Rate, which has been able to identify longer term market cycles with precision since 1900.
The Investment Rate paints a picture of systemic economic weakness, akin to both the Great Depression and Stagflation as that relates to reduced demand for assets in the United States. This is no limited to the Stock Market, but also includes the Housing Market, so HD is impacted in a few ways.
First, a reduced risk appetite for stocks will cause investors to shy from new investments in the stock market, but at the same time there is already a significantly reduced natural demand so we are expecting multiple contractions in the stock market in general.
Furthermore, economic weakness will wreak havoc on HD, whose business growth relies on a consumer who is willing to spend on upgrades and repairs
However, the most important part may come from the housing market and the impact natural demand reversions as those are defined by the Investment Rate will have on housing prices too.
Technical Summary
| Term → | Near | Mid | Long |
|---|---|---|---|
| Rating | Strong | Strong | Neutral |
| P1 | 125.53 | 109.00 | 116.00 |
| P2 | 127.86 | 121.14 | 128.61 |
| P3 | 129.48 | 131.72 | 139.86 |
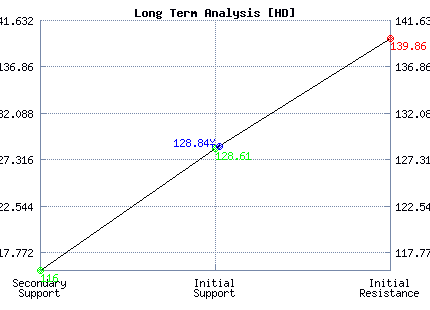
Support and Resistance Plot Chart for HD
Long Term Trading Plans for HD
March 15, 2016, 10:14 am ET
The technical Summary and associated Trading Plans for HD listed below will help you make important timing decisions for your trades. This data is based on our proprietary analysis for HD. In addition we offer Market Timing Models and Stock Filters in the links above which may increase the proficiency of the decisions you make.
HD - (Long) Support Plan
Buy over 128.61 target 139.86 stop loss @ 128.35.
The technical summary data tells us to buy HD near 128.61 with an upside target of 139.86. This data also tells us to set a stop loss @ 128.35 to protect against excessive loss in case the stock begins to move against the trade. 128.61 is the first level of support below 128.84 , and by rule, any test of support is a buy signal. In this case, support 128.61 is being tested, a buy signal would exist.
HD - (Short) Resistance Plan
Short under 139.86 target 128.61 stop loss @ 140.12
The technical summary data is suggesting a short of HD as it gets near 139.86 with a downside target of 128.61. We should have a stop loss in place at 140.12 though. 139.86 is the first level of resistance above 128.84, and by rule, any test of resistance is a short signal. In this case, if resistance 139.86 is being tested, a short signal would exist.


Blue = Current Price
Red= Resistance
Green = Support
Real Time Updates for Repeat Institutional Readers:
Factset: Request User/Pass
Bloomberg, Reuters, Refinitiv, Zacks, or IB users: Access Here.
Our Market Crash Leading Indicator is Evitar Corte.
Evitar Corte warned of market crash risk four times since 2000.
It identified the Internet Debacle before it happened.
It identified the Credit Crisis before it happened.
It identified the Corona Crash too.
See what Evitar Corte is Saying Now.
Get Notified When our Ratings Change: Take a Trial
