 pool ads
The 4th of July, and the FOMC Liquidity Drain
How To Trade Around this July 4 Holiday
During this July 4 Holiday Week we are witnessing classic trading patterns, and if that remains true we’re also likely to see another materialize as the week comes to an end.
These classic patterns began with window dressing last week. This is a practice where fund managers reposition their portfolios to hold the best stocks at the end of a quarter, so these stocks appear prominently on the quarterly statements sent to clients.
Technology stocks dominate the best performing stocks this year, and they are a focus on fund managers. In fact, five of the top 25 stocks (as shown below) have more volume than all of the other stocks combined. These are large cap stocks, and fund manager like the liquidity they provide too.
- Netflix (NASDAQ: NFLX) +219%
- Twitter (NASDAQ: TWTR) +171%
- Micron (NYSE: MU) +145%
- Adobe (NASDAQ: ADBE) +136%
- Amazon (NASDAQ: AMZN) +128%
Window Dressing was the first step, but it was closely followed by two others. At the beginning of every quarter the market realizes a strong inflow of 401k contributions. This money, by mandate of the plans and funds into which they are invested, must allocate the capital.
Again, tech and therefore tech funds have been doing best, so for any 401k investor chasing performance, they may allocate heavily to tech in their 401k plan too. I believe we saw this start after the middle of the day on Monday. The NDX seemed to shoot straight up again after that.
This 401k influence is real, but we can never be exact in real time, and the same goes for the third observation pertaining to this July 4 Holiday week. Typically, during Holiday weeks like this smaller investors have more control of the market, because larger investors are vacationing. This is usually obvious during Christmas and Thanksgiving to a larger degree, but the same holds true for this one, especially because the Holiday is in the middle of the week.
So far, everything about this Holiday week supports these classic patterns, and if that remains true we are also likely to see a third. Those fund managers who took positions that they may not have otherwise taken to dress up their portfolios during window dressing often reverse out of those positions too.
In fact, my observations tell me that many fund managers are becoming uncomfortable with tech valuation, and although most individual investors do not seem to care yet, even the slightest degree of institutional apprehension could cause managers to sell into the strength as they return from vacations.
If these classic holiday patterns continue the market is set up to see selling pressure resume late this week or early next week.
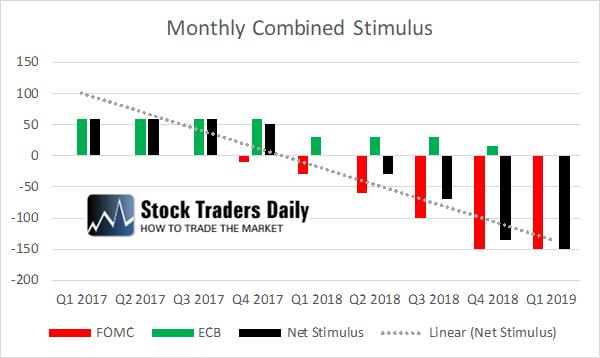
Officially, massive FOMC liquidity drains are hitting in Q3 as well, and if that removes buyers from the table it could spell longer term trouble for equities. Investors should be using proactive rules-based trading strategies like our Strategic Plan Strategy (+33% YTD) or our Sentiment Table Strategy (+17% YTD), so navigate the conditions that lay ahead. Review our Strategies.
The Chart below shows the liquidity drain.

Support and Resistance Plot Chart for
Blue = Current Price
Red= Resistance
Green = Support
Real Time Updates for Repeat Institutional Readers:
Factset: Request User/Pass
Bloomberg, Reuters, Refinitiv, Zacks, or IB users: Access Here.
Our Market Crash Leading Indicator is Evitar Corte.
Evitar Corte warned of market crash risk four times since 2000.
It identified the Internet Debacle before it happened.
It identified the Credit Crisis before it happened.
It identified the Corona Crash too.
See what Evitar Corte is Saying Now.
Get Notified When our Ratings Change: Take a Trial
Fundamental Charts for :