Predictive AI
Adds Alpha, Reduces Beta, Controls Risk
Monitor the Long Term Growth Trends for Apple Inc. (NASDAQ:AAPL)
The long term trend in the growth rate for companies is extremely important to recognize because it helps investors properly value the companies they are interested in. However, with a company as big as Apple Inc. (NASDAQ:AAPL), and one who has so many loyal followers, avoiding the influence of the masses may be as difficult as it is for small town jurors, but in this case it is very important to remain rational.
Over the past few earnings cycles, Apple has seen a trough in earnings growth. In the third quarter of 2013 earnings from Apple contracted by about 10% from the year prior. Since then, earnings growth has not been that bad, and officially, last quarter, the company started to grow again. According to current analysts' estimates, the company is also expected to continue along that path.
Our EPS growth chart below shows the trend in earnings growth on a yearly basis. We use 12 month trailing data for this observation, and as an example, we compare the trailing 12 month data this quarter to the trailing 12 month data that existed in the same period of last year to determine the yearly growth rate in earnings for this current quarter. The trough in earnings is quite clear from this chart.
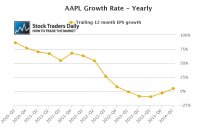
We cannot yet say that earnings growth has turned up solidly, but if the company matches estimates the yearly growth rate in our chart will increase to about 7.4%. The current growth rate is 4.5%, and the multiple of 15.5x compared to that 4.5% growth rate makes the stock look expensive, but if Apple manages to grow at 7.4% not only will the earnings growth chart show more of a turnaround, but the multiple will not look nearly as rich.
This observation does not suggest that multiple expansion is likely, but it does suggest that if Apple manages to meet analysts' expectations when it reports earnings it will at least be more close to fairly valued.
On a technical know, Apple is in the upper tier of its longer term trading channel and there are no immediate catalysts to buy or sell the stock. That can change when earnings are released, so monitor the stock price in conjunction with the support and resistance levels in our real time trading report for AAPL, but at the time this article was written there were no immediate catalysts to trade one way or the other.
⚠Triggers may have already come
Support and Resistance Plot Chart for
Blue = Current Price
Red= Resistance
Green = Support
Real Time Updates for Repeat Institutional Readers:
Factset: Request User/Pass
Bloomberg, Reuters, Refinitiv, Zacks, or IB users: Access Here.
Our Market Crash Leading Indicator is Evitar Corte.
Evitar Corte warned of market crash risk four times since 2000.
It identified the Internet Debacle before it happened.
It identified the Credit Crisis before it happened.
It identified the Corona Crash too.
See what Evitar Corte is Saying Now.
Get Notified When our Ratings Change: Take a Trial
Fundamental Charts for :