 pool ads
Stock of The Week: Costco Wholesale Corporation (NASDAQ:COST)
Costco Wholesale Corporation (NASDAQ:COST) has been selected as the Stock of the Week by Stock Traders Daily this week. This is a Strategy selection based on a combined analysis that starts with an evaluation of market conditions and definable support and resistance levels.

In this case, the call respected resistance levels in the S&P 500, but given recent momentum also anticipated that resistance lines may break in the S&P 500 like they already have in the NASDAQ. This was also supported by midterm observations in the DJIA and Russell 2000, which each open the door for modestly higher levels and especially so if the S&P can follow the NASDAQ.
The preliminary observation for this week's selection was that probability, and that limited our interest in buying stocks this week to focus on ONLY the ones that were also set to break resistance levels like the S&P might do. This restriction is very important because not only does that increase the probability of going with the flow of the market, both would need to break resistance to trigger, but it also restricts our entry level and, if the market fails to increase and if COST fails to increase no triggers will come and the week may end without any trades in this strategy.
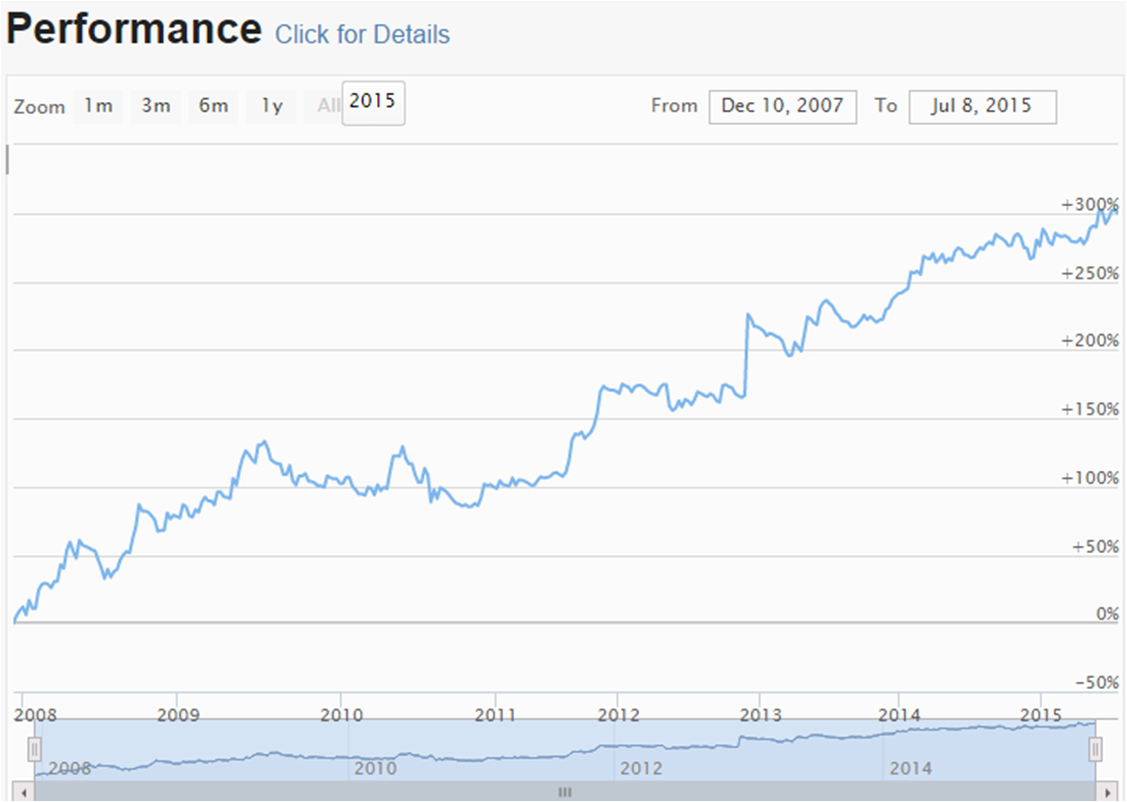
The Stock of the Week Strategy has had many weeks where no trades have been made, but the increased probability associated with market evaluation in this strategy over time and the associated risk controls it imposes has allowed it to outperform the S&P 500 significantly over time.
We cannot be sure that this will continue, past performance is no guarantee of future results, but the methodology is steadfast and the strategy has been proven in down markets too, it began in December of 2007, so we remain confident.
The selection this week was absolutely a combined market timing and stock selection approach in line with what we have been doing in the Stock of the Week Strategy for almost 8 years now. COST is our stock of the week this week.
Although our market analysis and Technical observations are most important to this strategy (those can change during the week so we must remain nimble), here are fundamental graphs associated with the call as well.
Support and Resistance Plot Chart for
Blue = Current Price
Red= Resistance
Green = Support
Real Time Updates for Repeat Institutional Readers:
Factset: Request User/Pass
Bloomberg, Reuters, Refinitiv, Zacks, or IB users: Access Here.
Our Market Crash Leading Indicator is Evitar Corte.
Evitar Corte warned of market crash risk four times since 2000.
It identified the Internet Debacle before it happened.
It identified the Credit Crisis before it happened.
It identified the Corona Crash too.
See what Evitar Corte is Saying Now.
Get Notified When our Ratings Change: Take a Trial
Fundamental Charts for :