Target Corporation (NYSE:TGT) Is A Highly Risky Stock
Sometimes investors buy stocks because they hope that the company will start to perform, but eventually that hope turns sour, especially if the company continuously fails to demonstrate acceptable earnings growth. In addition, what would seem to be unwarranted stability in the share prices of companies which are experiencing EPS contractions could turn on a dime if liquidity concerns hit the market as the FOMC Tapering program turns Net Real Stimulus (NRS) negative.
The retail sector has come into question, it started with concerning first quarter GDP results this year, and today Goldman Sachs Group Inc (NYSE:GS) downgraded a number of high end retailers. Wal-Mart Stores, Inc. (NYSE:WMT) also reported earnings, adding to the relative concern in this sector, but our focus in this article is Target Corporation (NYSE:TGT)
Specifically, we are looking for a sign from Target that might support the general concern in the retail sector today. What we have found is extremely important and should be observed closely by anyone who cares about valuation.
First, the trend for earnings, excluding onetime events, has been generally positive until recently. Our analysis excludes onetime events, and based on our observations the company clearly goes through earnings cycles but the peaks in the earnings cycles have been hired consistently than the prior peak and the lows have been higher than the prior lows, showing that the company had been growing earnings nicely, until about a year ago.
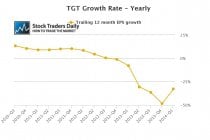
According to our observations of the yearly growth rate for Target, the yearly growth rate is now -32%, where back in 2010 it was as much as 13.3%. Our calculation is a trailing 12 month calculation that compares the current quarter's 12 month trailing data to the same data for the same period from last year, and we do that for every quarter, which allows us to plot the yearly growth trend for Target and every other stock we follow. The yearly growth rate first became negative in the fourth quarter of 2012, but it has been declining steadily since 2010, and it looks awful right now.

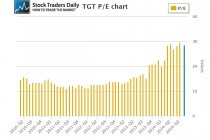
Interestingly, at virtually the same time that yearly earnings growth began to turn negative multiple expansion took place and the PE multiple for Target when from near 12 to near 30 times earnings, and it rests at 28 times earnings today. The stock price, however, is not much different today than it was in 2012, suggesting that the decline in earnings was offset by multiple expansion, but that did nothing to actually influence the stock price higher on a sustainable basis.

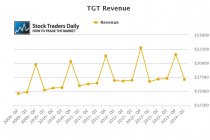
More concerning, revenue growth experienced its first lower high two quarters ago and that is a major red flag for investors who realize that revenue growth is essential for earnings growth at Target.

Furthermore, our observations suggest that a company who is not growing earnings but who instead has negative earnings growth does not deserve a multiple like the one afforded to Target at this time, so our fundamental observations suggest that Target is extremely overvalued and unless the company experience is a 180° turn investors who pay attention to value will continue to avoid Target.
Given the lack of performance in the stock for the past 1.5 years, our observations also suggest that investors who are looking for value, and even growth, have not been very interested in Target, but if the market begins to turn stocks that are extremely overvalued like Target seems to be are likely to be hit hardest.
According to our real time trading report for Target, the stock is right in the middle of a longer term trading channel and there are no compelling reasons to buy, sell, or short the stock right now, other than of course our general market observations and our macro economic analysis, The Investment Rate, which paint a picture of a much different stock market environment in the months and years ahead.
Lastly, the $0.78 Expectation for EPS on August 20th will do nothing to help the negative EPS Growth picture, if the company reports in line with estimates.
Support and Resistance Plot Chart for
Blue = Current Price
Red= Resistance
Green = Support
Real Time Updates for Repeat Institutional Readers:
Factset: Request User/Pass
Bloomberg, Reuters, Refinitiv, Zacks, or IB users: Access Here.
Our Market Crash Leading Indicator is Evitar Corte.
Evitar Corte warned of market crash risk four times since 2000.
It identified the Internet Debacle before it happened.
It identified the Credit Crisis before it happened.
It identified the Corona Crash too.
See what Evitar Corte is Saying Now.
Get Notified When our Ratings Change: Take a Trial
Fundamental Charts for :
