 pool ads
The Fundamental Disconnect at Microsoft Corporation (NASDAQ:MSFT)
Sometimes investors become extremely hopeful and they stop paying attention to the fundamentals. Sometimes those hopes are fulfilled and everything works in their favor too, but for those investors who are basing an investment on the hope that earnings growth will improve ignore signs that might suggest sentiment is changing, they may find themselves in trouble.
Analysts are expecting solid growth from Microsoft Corporation (NASDAQ:MSFT) in the next fiscal year, 17% to be exact, but the comps from last year are easy, the growth rate if you look at the company on a trailing 12 month year over year basis is actually negative, and although revenue levels are better than they were, there are serious current fundamental concerns at Microsoft.
Let's start by taking a look at the trailing 12 month earnings graph for Microsoft since 2009. We compile the data first by excluding onetime events to focus on earnings from operations, we calculate trailing 12 month data for every quarter, and compare that year over year to compile the yearly growth rate chart offered for Microsoft below.
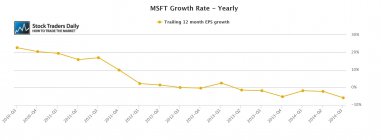
Currently, the yearly growth rate for Microsoft is -5.9%, and this yearly earnings growth rate has been negative for five consecutive quarters.
Interestingly, however, almost like clockwork, immediately when the yearly earnings growth turned negative the PE multiple began to increase. The PE multiple at Microsoft was about 11 times earnings, and it broke 18 times earnings recently, that's a 63% increase in the multiple, but it happened during a period when earnings actually weakened.
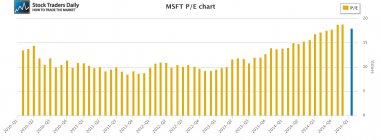
On a fundamental basis, that is a major concern.
Technical take:
According to our real time trading report for Microsoft (MSFT Report) the stock has just tested longer term support and by rule tests of longer term support our buy signals. However, because our buy signals are restricted to tests of support, if support levels begin to break those also act as our risk control, so our technical observations suggest not only that Microsoft has tested support and is offering a buy signal, but it also tells us that if support breaks we should sell those positions and not look back. If Microsoft breaks longer term support it will be very bearish, but thus far support is holding.
Summary:
There is a clear fundamental disconnect between the price earnings multiple at Microsoft and the earnings growth rate. Analysts seem to be positive with respect to their outlook for the next fiscal year, which ends in June, but according to our observations the yearly earnings growth rate for Microsoft is not going to improve that much when we look at earnings from operations. On a fundamental basis there are plenty of reasons to be concerned and the aggressive increase in the multiple during a time when earnings growth deteriorated opens the door for aggressive declines if the sentiment of investors in Microsoft changes. One of the indicators to a changing sentiment could be the ability or the inability of the stock to hold longer term support, which was tested on Tuesday. Support is holding thus far, which suggests that the positive sentiment is holding thus far as well, but if longer term support begins to break that positive outlook could change and multiple contractions could bring the stock much lower.
Disclaimer: Stock Traders Daily provides trading strategies, which by definition incorporate risk controls, and it has only engaged in buy and hold strategies twice since the turn of the century. The first was in October of 2002, and those buy and hold strategies lasted until 2006, and the second was in February of 2009, and those buy and hold strategies lasted until the end of 2010. Every point in between Stock Traders Daily has been providing risk controlled strategies, market based strategies, and strategies for approximately 3000 individual stocks, which are unbiased and which incorporate the notion that short term gains lead to long term success. There is a time and a place for buy and hold strategies and this is neither the time nor the place for that approach in our opinion. Risk controls are essential.
Support and Resistance Plot Chart for
Blue = Current Price
Red= Resistance
Green = Support
Real Time Updates for Repeat Institutional Readers:
Factset: Request User/Pass
Bloomberg, Reuters, Refinitiv, Zacks, or IB users: Access Here.
Our Market Crash Leading Indicator is Evitar Corte.
Evitar Corte warned of market crash risk four times since 2000.
It identified the Internet Debacle before it happened.
It identified the Credit Crisis before it happened.
It identified the Corona Crash too.
See what Evitar Corte is Saying Now.
Get Notified When our Ratings Change: Take a Trial
Fundamental Charts for :