The Market Crash of 2016
The first two weeks of 2016 have been awful for investors who depend on the market to increase to make money, but there is a reason for it and everyone needs to understand the underlying dynamics of the market, which go over and above what is happening in China, Iran, Saudi Arabia, or anywhere else in the world because it is a simple supply and demand equation that's driving equity prices at this time.
Before I continue it is important for you to understand exactly what I expect and how I have positioned myself in terms of an analyst over the past 1.5 years.
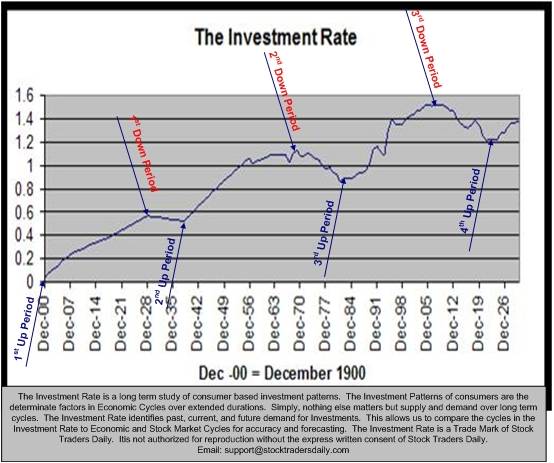
The backbone of my macroeconomic observations is a proprietary tool called the Investment Rate, and the Investment Rate measures the natural rate of change in the demand for new investments in the US economy on an annualized basis, dating back to 1900, and extending beyond 2030. This measure has identified every major market cycle since 1900, the good times and the bad, it even pinpointed the beginning and end of the great depression and stagflation, and I used it to identify the peak of the market in 2007 and the impending turned down as well, but over the past few years there has been a distortion to this otherwise highly accurate longer-term leading indicator.

The distortion came from stimulus. Because the Investment Rate measures the natural rate of change in the demand for new investments and because stimulus in essence created a fabricated demand for investments, stimulus caused a blip in the cycle defined by the Investment Rate.
The Investment Rate told us that the U.S. economy and stock market was entering into a prolonged down period at the end of 2007 that would be worse than the great depression or stagflation, and initially that started to happen like clockwork, but when the FOMC started pouring money into the economy and creating a fabricated demand it offset those natural cycles.
By the way, the Investment Rate is predicated on the investment patterns of individuals defined by societal norms that have been ingrained and continue to be ingrained in our everyday lives.
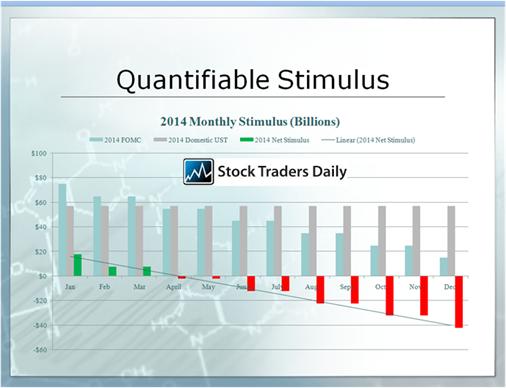
This fabricated demand infuse by the FOMC served a purpose, it stabilized the otherwise deteriorating demand ratios defined by the Investment Rate, and actually increased demand measurably as the program continued, but by the middle of 2014 the combined efforts of the U.S. treasury and Federal reserve stopped stimulating the U.S. economy.
In fact, my observations told me that in the middle of 2014 the combined efforts of the U.S. treasury and the FOMC actually began draining liquidity from the Financial System for the first time in years. That was a big red flag and a warning to me and I began mobilizing my concerns about the risks of an all out market crash. The premise was that a reversal back to the natural demand rates as those are defined by the Investment Rate would cause multiple contractions in the stock market, based on simple supply and demand.

However, that's not exactly what happened is it? Instead of declining from the middle of 2014 the stock market actually looked strong from time to time, although it is arguably still at those levels today after coming down aggressively recently. The question I must ask myself as an analyst is why did the stock market increase instead of fall, as my liquidity observations suggested it would from the middle of 2014?
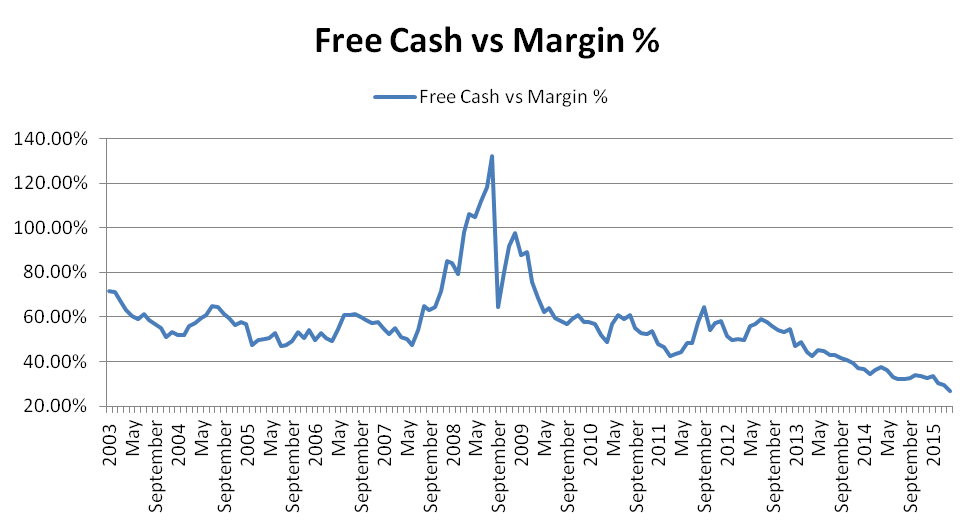
The answer is margin debt increased aggressively and as margin debt increased aggressively the investment community was able to sustain multiples even though the real underlying demand for new investments as that is defined by the Investment Rate was much lower and a reversion from a level of demand that was influenced by stimulus to the natural demand level identified by the Investment Rate had already begun.
It's important for me to reiterate this. A reversion to the natural demand rate as that is defined by the Investment Rate began back in the middle of 2014, but we did not see it clearly because margin debt levels increased considerably from the middle of 2014 until recently.
In many ways that kept the multiples high, but as that margin debt increased the net cash to margin debt ratio actually hit an all time low in the middle of 2015. In simple terms, that meant that institutional investors had leverage themselves as a group more than they ever had before.

As a result, as 2015 came to an end we knew that margin debt was already extremely high so it was very difficult for the market to expand based on increasing margin debt levels again like it did from the middle of 2014, and we knew that a reversion back to the natural demand levels as those are identified by the Investment Rate had already begun and were well underway, and that served as a material warning that the market would crash in 2016.
Reasonably, we could see this a long time ago, but 2015 was a unique year because it was the third year of a second cycle presidential term and the market had never been down in the third year of a second term in history and had rarely been down in the third year of a third term at all, so investors who are trading based on an almanac of the market had reason to believe the market would remain stable.
In many ways, that's exactly what happened. The market remained stable even though margin debt levels increased dramatically, and that's because the underlying demand levels as those are defined by the Investment Rate declined at the same time.
We were watching this happen all year, but we did not warn of an impending market crash in calendar 2015 because of the oddity of that third year presidential cycle, but as the end of 2015 rolled around our tone changed and by the end of the year a distinct warning of an impending market crash in calendar 2016 was made absolutely clear. We recommended to clients that they become proactive with their investments, get out of buy and hold strategies, and sell excess real estate.
Importantly, the fabricated demand for assets influenced real estate too, and the Investment Rate measures natural demand for real estate as well, so real estate is absolutely part of this discussion.
However, our focus is on the stock market, and my focus is on the risks associated with 2016. We have been preparing for a market crash, and the ducks are in a row. The stock market is set up to crash because the natural demand levels as those are defined by the Investment Rate are much lower, which in itself suggests that multiple contractions can come, but because margin debt levels have been so excessively high there is also added selling pressure as institutions wind down some of those margin based positions.
Given all of this information, and the risks that we see as the year continues, we also recognize that trading opportunities will come all the time. In fact, trading opportunities will be regular and potentially rewarding, but trading and buy and hold strategies are two different animals.
For traders, we have identified buying opportunities according to the alerts offered in our sentiment table strategy. Our sentiment table suggests that investors buy the market for a short-term time frame in expectation of a bounce from an oversold market condition, but with the intention of selling it on the heels of that bounce as well.
Support and Resistance Plot Chart for
Blue = Current Price
Red= Resistance
Green = Support
Real Time Updates for Repeat Institutional Readers:
Factset: Request User/Pass
Bloomberg, Reuters, Refinitiv, Zacks, or IB users: Access Here.
Our Market Crash Leading Indicator is Evitar Corte.
Evitar Corte warned of market crash risk four times since 2000.
It identified the Internet Debacle before it happened.
It identified the Credit Crisis before it happened.
It identified the Corona Crash too.
See what Evitar Corte is Saying Now.
Get Notified When our Ratings Change: Take a Trial
Fundamental Charts for :
