Predictive AI
Adds Alpha, Reduces Beta, Controls Risk
The Strategic Plan Strategy Bought ProShares Ultra Dow30 (ETF) (NYSEARCA:DDM)
The stock market is absolutely volatile, investors are absolutely nervous, and recent declines have rattled many nerves, but one thing is also true. According to our combined technical analysis of the Dow Jones industrial average and the S&P 500, important intra channel support levels were tested on Tuesday, and after testing those support levels the markets have bounced solidly.
Additional volatility exists, it's almost irrational not to expect volatility given what has occurred recently, but the test of those important inflection levels on Tuesday and the subsequent bounce is that have taken place suggest that higher levels can also come as we target neutral resistance lines accordingly.
The objective of this observation is to illustrate our upside target and not to suggest entry levels for new positions. The actionable catalyst given what has transpired was to buy on the heels of the test of support that has already occurred. Our Strategic Plan Strategy, which is predicated on longer term support and resistance levels for the Dow Jones industrial average, triggered a buy of ProShares Ultra Dow30 (ETF) (NYSEARCA:DDM) when the test happened on Tuesday, and that position is already in the money by approximately 4.5%.
Our objective with this strategy is to initiate profit stops when our net profit gets to 8% with a target return of 10% or more assuming our profit stop doesn't hit. As a result, initiating a trade at this level would essentially be closer to our exit than our entry.
Furthermore, we are in the middle of the channel now, and by rule we do not initiate trades in the middle of a trading channel. We initiated DDM near support levels and those support levels serve two purposes. First, support tells us where to enter the trade, but support also tells us where to exit.
Therefore, by buying near support levels we also keep our risks under tighter control, and that's essential in a market that acts like ours has recently.
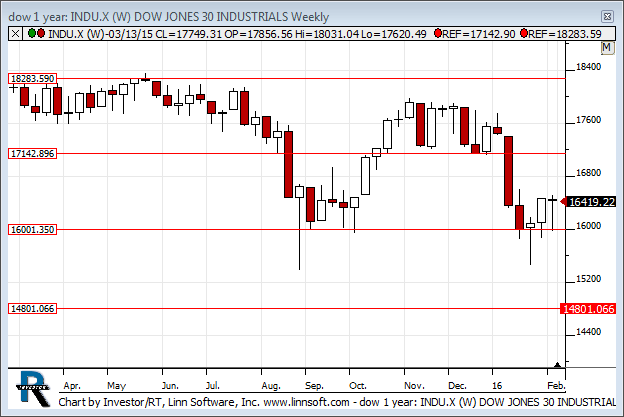
Notwithstanding the volatility that exists today, and the uncertainties in the minds of just about every investor you talk to, one thing is certain and that is that our support levels were tested and by rule we target resistance levels when that happens. In the case of the Dow Jones industrial average, our longer-term resistance level is 17,142.
Importantly, we will not likely hold our current trade all the way through to that level. Most often our profit stops trigger somewhere before we get there, but that's not always the case. Subscribers to our service will get updates when they trigger.
Immediately, given the successful tests of support that happened on Tuesday, our upside target for the Dow Jones industrial average is 17142. We initiated buys near support levels and we're getting close to a profit stop threshold but we're not there quite yet. Our Strategic Plan Strategy is double long the dow Jones industrial average by rule, and it will stay that way until either our profit stop is triggered, the Dow Jones industrial average tests resistance, or we will also sell this position if the dow Jones industrial average reverses lower and breaks support instead.
⚠Triggers may have already come
Support and Resistance Plot Chart for
Blue = Current Price
Red= Resistance
Green = Support
Real Time Updates for Repeat Institutional Readers:
Factset: Request User/Pass
Bloomberg, Reuters, Refinitiv, Zacks, or IB users: Access Here.
Our Market Crash Leading Indicator is Evitar Corte.
Evitar Corte warned of market crash risk four times since 2000.
It identified the Internet Debacle before it happened.
It identified the Credit Crisis before it happened.
It identified the Corona Crash too.
See what Evitar Corte is Saying Now.
Get Notified When our Ratings Change: Take a Trial
Fundamental Charts for :