Predictive AI
Adds Alpha, Reduces Beta, Controls Risk
Trading Analysis for Wal-Mart Stores, Inc. (NYSE:WMT)
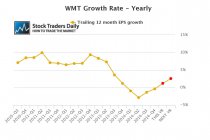
Our combined analysis for Wal-Mart Stores, Inc. (NYSE:WMT) describes a company that lacks fundamental value and a stock that is trading near technical support levels. Our identification of fair value is based on earnings growth, and earnings are not expected to grow meaningfully at Wal-Mart anytime soon. Earnings growth has actually been contracting for the past four quarters, if analysts are right about earnings expectations for 2015 earnings will only grow by 1.19%, and if they are right about calendar 2016 earnings growth will only be 2.56%. It is hard to justify a PE multiple of almost 17 times earnings when growth rates are virtually nonexistent.
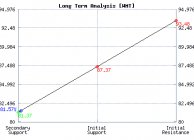
Interestingly, our trading analysis does suggest that Wal-Mart, the stock, if it holds support, can move higher. The catch is that Wal-Mart, the stock, must hold support. Although this support level will change over time, so updates to our report should be made regularly, the support level identified today is $81.37. If Wal-Mart is able to hold support we would expect the stock to increase to $93.48.
Support, however, is also our risk control, and by rule we only buy stocks or short stocks near important inflection levels like this, so if this longer term support level begins to break not only would this suggest that investors who bought near support sell their position, but it would also open the door for shorts to get involved in the stock as well.
Disclaimer: Stock Traders Daily offers real time trading reports for over 4000 companies, market analysis for the Dow Jones industrial average, S&P 500, NASDAQ, and Russell 2000, and favors strategies that correlate to market direction and therefore market timing plays a role in our observations. Investing in the stock market involves a high degree of risk and everyone should consult with their Financial Advisors before making the decision to buy or sell. This article does not suggest that anyone buy or sell this stock or any other stock accordingly.
⚠Triggers may have already come
Support and Resistance Plot Chart for
Blue = Current Price
Red= Resistance
Green = Support
Real Time Updates for Repeat Institutional Readers:
Factset: Request User/Pass
Bloomberg, Reuters, Refinitiv, Zacks, or IB users: Access Here.
Our Market Crash Leading Indicator is Evitar Corte.
Evitar Corte warned of market crash risk four times since 2000.
It identified the Internet Debacle before it happened.
It identified the Credit Crisis before it happened.
It identified the Corona Crash too.
See what Evitar Corte is Saying Now.
Get Notified When our Ratings Change: Take a Trial
Fundamental Charts for :