 pool ads
Trading the S&P Head and Shoulders Formation with SDS and SSO
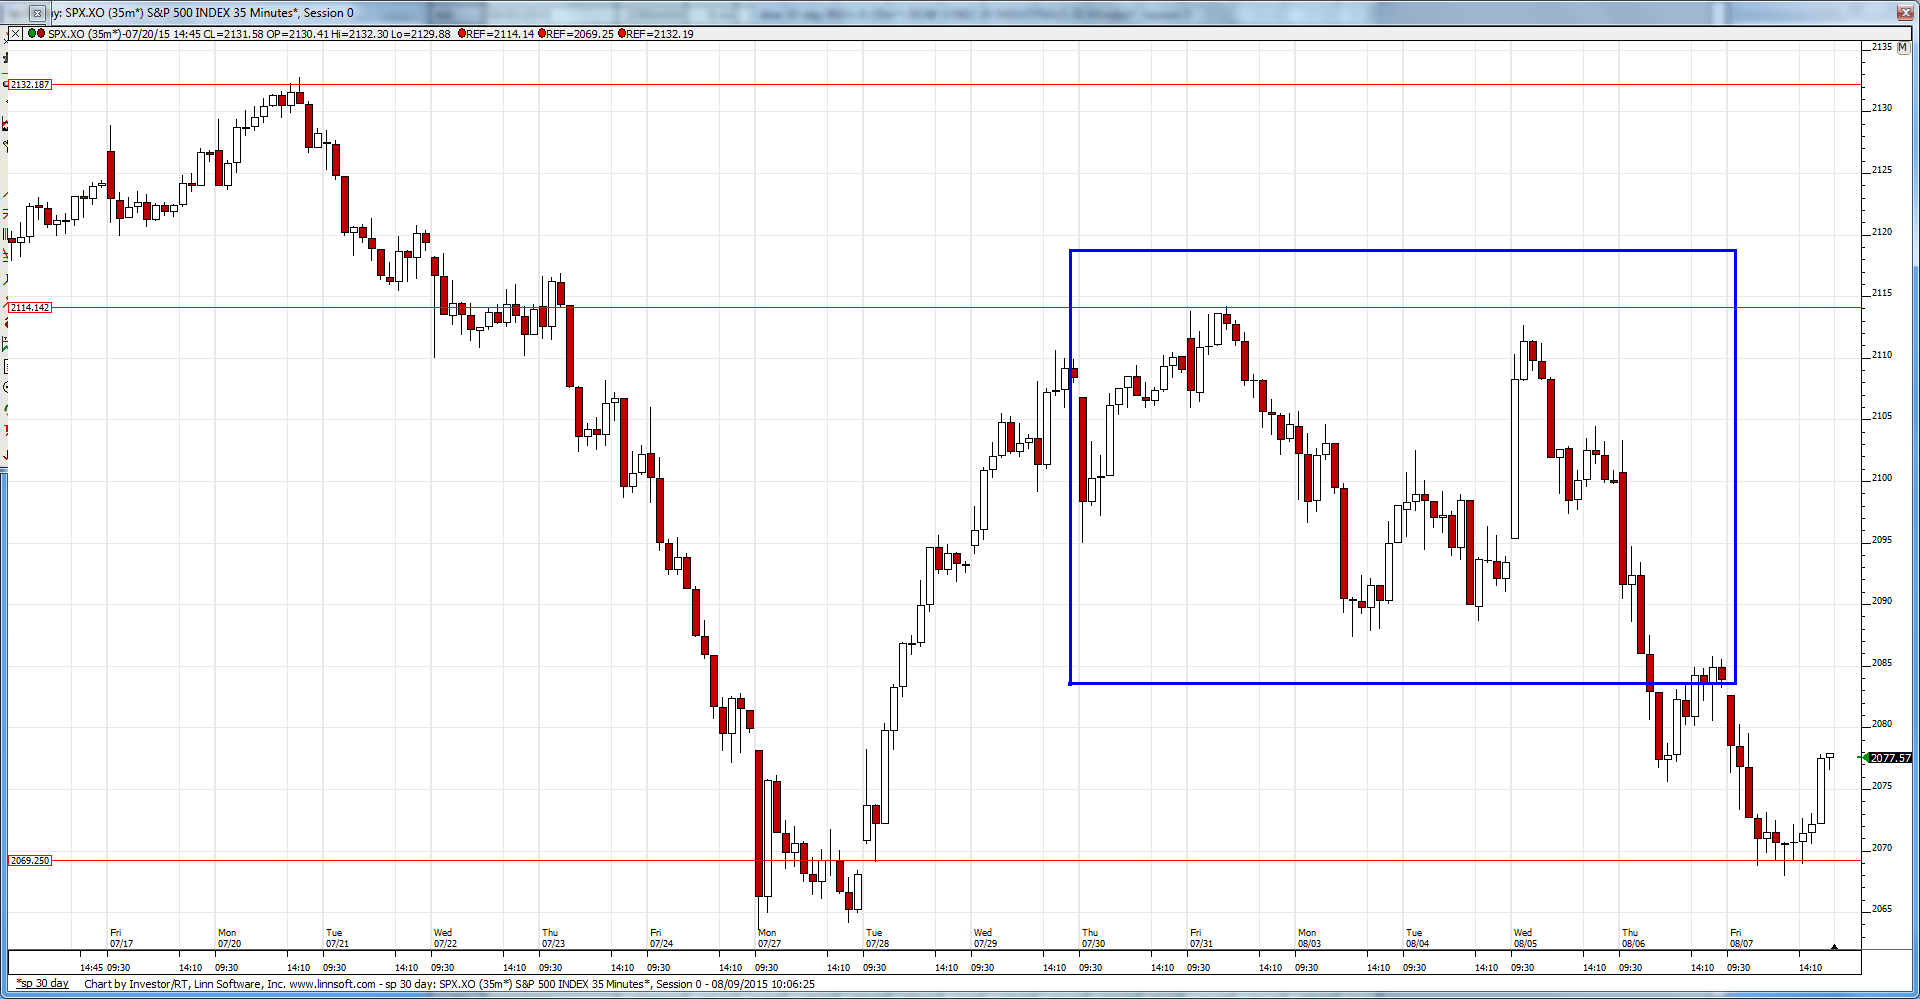
The technical channels offered by the markets in recent days have been near perfect for anyone using technical analysis. I am not speaking to intraday trends, because those vary from day to day, but to the broader trends that better define opportunities for swing trading. See Chart below...

That is an exceptional and almost perfect example of a Head and Shoulders pattern, and it happened right in front of your eyes (if you have been watching the market). This is a chart of the S&P 500 and our focus is the period between 7.27.15 and 8.7.15, although I have highlighted the in-between Head and Shoulders pattern to make sure it is obvious too.
As you can see, there were excellent opportunities for both buying and shorting the market for a near term trade. There was also a 45-point market spread between the low point in this graph and the double top that happened in conjunction with the Head and Shoulders pattern. That's roughly 2% in S&P terms, but when we incorporate the use of the ETFs we recommend with these technical strategies the result doubles.
We recommend using ProShares Ultra S&P500 (ETF) (NYSEARCA:SSO) and ProShares UltraShort S&P500 (ETF) (NYSEARCA:SDS) to trade long and short respectively; these track the S&P almost exactly (SDS is inverse), and they are extremely liquid, allowing for large block trades so institutional traders can get in and out with ease.
Arguably, these channels are very easy to see after the fact; the challenge is seeing them before they form, while they are in the process of forming. One of the best ways to do that is to use a 'Sentiment Table' to define overbought or oversold conditions. This is exactly how we started the process on 7.28.15; we received an oversold indicator from our Sentiment Table.
That set the stage for communicating the developing patterns, the lower high, and the Head that developed, but most importantly, and possibly the indicator that was most actionable, it also allowed us to identify the overbought signal that came on the heels of the snap back from the 7.27.15 low. That set the stage for yet another exceptional profit taking opportunity as the market completed the head and shoulders formation and fell back to the 7.28.15 level that prompted the oversold condition in the first place. That was a profit taking signal, but interestingly there was not an oversold condition from the Sentiment Table at that time.
I am pointing this out in relative detail because it is unreasonable for anyone to take advantage of EVERY signal, even when the patterns are as perfect as this past week offered, but when you identify the Overbought and Oversold conditions in conjunction with the developing patterns it certainly can result in a handsome profit. Ultimately, that is what trading is all about.
Although even the sharpest technical trader might not be able to get every turn, if all that happened was the initial oversold indicator was realized and the subsequent overbought indicator was realized, given the spread between the lows and the double top, the profit potential using 2x ETFs was as much as 8%. That's not bad for not getting every turn. Our Sentiment Table returned less than that, but I do not believe in trying to squeeze out every drop of juice from every trade.
I hope this serves as a great example.
If you watch the technical trends opportunities surface; it is an active strategy approach of course, maybe not for buy and hold investors, but it is great for people who like the concept of 'sticking and moving.' One additional mention is that when there are no indicators anyone who is following technical trends can just sit in cash and wait for the next one to surface, and in the process remove all market risk from the approach during that waiting period. Thus far this year that has been 73% of the time...
Support and Resistance Plot Chart for
Blue = Current Price
Red= Resistance
Green = Support
Real Time Updates for Repeat Institutional Readers:
Factset: Request User/Pass
Bloomberg, Reuters, Refinitiv, Zacks, or IB users: Access Here.
Our Market Crash Leading Indicator is Evitar Corte.
Evitar Corte warned of market crash risk four times since 2000.
It identified the Internet Debacle before it happened.
It identified the Credit Crisis before it happened.
It identified the Corona Crash too.
See what Evitar Corte is Saying Now.
Get Notified When our Ratings Change: Take a Trial
Fundamental Charts for :