Predictive AI
Adds Alpha, Reduces Beta, Controls Risk
UnitedHealth Group Inc. (NYSE:UNH) Looks Expensive
Healthcare Companies and Obamacare seem to go hand in hand in most discussions, and the general notion is that companies will benefit from the mandates as they earn more money and solidify revenue streams, but are they doing that at the mercy of growth rates? Thus far, one company is.
The price earnings multiple of UnitedHealth Group Inc. (NYSE:UNH) is over 15, but the company has been growing earnings only slightly over 3%, and on a quarterly growth has actually turned negative, so something seems amiss.
In our EPS growth charts, we calculate trailing 12 month EPS for every quarter, and in our quarterly growth chart we plot that change in the trailing 12 month data quarter by quarter. The yearly growth rate chart we plot that change in data between this quarter and the same quarter of the previous year to define yearly growth rate trends respectively.
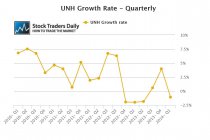
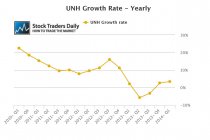
An observation of these charts discloses that United Health Group has had negative quarterly growth rate trends recently, but the yearly growth rate chart shows us that the company actually may have reached an earnings trough and it may have begun to recover or at least stabilize. Yearly growth rate chart shows us that yearly growth was negative until recently, adding support the notion that earnings growth rates may stem their decline.
Unfortunately, the street is expecting United Health Group to report earnings of $1.26, which would be lower than the same period a year ago, and add downward pressure on the yearly growth rates we are observing. Because those yearly growth rates are already barely above 3%, and the forthcoming report, if it is in line with analysts' estimates, would cause that 3% rate to decline as well, the current PE multiple of 15 looks rich and from a valuation perspective concerns exist.
The stock is approaching a level of longer-term resistance as that is defined in our real time trading report for UNH, and therefore modest upside appears likely according to our technical observations, but if longer term resistance is tested and it holds we will then expect the stock to decline more aggressively. This could be considered in line with our fundamental observations above, but because price matters more to traders resistance should be monitored closely.
⚠Triggers may have already come
Support and Resistance Plot Chart for
Blue = Current Price
Red= Resistance
Green = Support
Real Time Updates for Repeat Institutional Readers:
Factset: Request User/Pass
Bloomberg, Reuters, Refinitiv, Zacks, or IB users: Access Here.
Our Market Crash Leading Indicator is Evitar Corte.
Evitar Corte warned of market crash risk four times since 2000.
It identified the Internet Debacle before it happened.
It identified the Credit Crisis before it happened.
It identified the Corona Crash too.
See what Evitar Corte is Saying Now.
Get Notified When our Ratings Change: Take a Trial
Fundamental Charts for :