Predictive AI
Adds Alpha, Reduces Beta, Controls Risk
Valuation analysis for Abbott Laboratories (NYSE:ABT)
Immediately after the early 2013 spinoff, earnings and revenue declined measurably for Abbott Laboratories (NYSE:ABT), but in addition to that we can see that earnings growth has been realized subsequently as well.
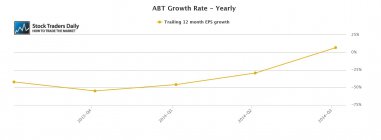
Our evaluation of earnings growth considers trailing 12 month data and compares that on a quarterly basis, excluding onetime events to best defined earnings from operations, to determine yearly growth rates. According to our observation the yearly growth rate of Abbott labs is 6.97%.
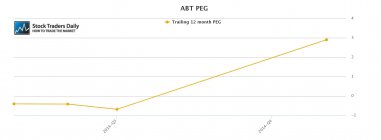
Pursuing our interest in fair valuation our attention then turns to the PE multiple, and the PE multiple for Abbott labs skyrocketed after the spinoff. The PE multiple increased from about 9 times earnings to over 20 times earnings, which is where it stands today.
That brings fair valuation into question, and considering the recent EPS growth rate the current multiple levied on ABT at this time is not in line with the growth rate from operations of the company. The current valuation placed on Abbott labs is about three times its growth rate, suggesting to us that the stock is overvalued on a fundamental basis.
Technical take:
According to our real time trading report for Abbott labs the stock tested longer term support most recently and it appears to be in the process of increasing towards longer term resistance. We would expect, therefore, the stock to continue to move higher and test resistance by rule.
Summary:
Our observations suggest that Abbott labs looks rich on a fundamental basis, the stock has a PE multiple that is far higher than its associated growth rate, but the stock is progressing towards longer term resistance. Assuming that the stock continues to move higher and officially tests longer-term resistance, we would be Sellers of Abbott labs at longer term resistance given the fundamental observations and what then would be technical supporting evidence to sell the stock.
⚠Triggers may have already come
Support and Resistance Plot Chart for
Blue = Current Price
Red= Resistance
Green = Support
Real Time Updates for Repeat Institutional Readers:
Factset: Request User/Pass
Bloomberg, Reuters, Refinitiv, Zacks, or IB users: Access Here.
Our Market Crash Leading Indicator is Evitar Corte.
Evitar Corte warned of market crash risk four times since 2000.
It identified the Internet Debacle before it happened.
It identified the Credit Crisis before it happened.
It identified the Corona Crash too.
See what Evitar Corte is Saying Now.
Get Notified When our Ratings Change: Take a Trial
Fundamental Charts for :