Predictive AI
Adds Alpha, Reduces Beta, Controls Risk
Valuation analysis for Alcoa Inc (NYSE:AA)
When we listen to smart money we tend to make much better decisions than when we listen to our neighbor, an analyst on CNBC, or even out gut. Smart money almost always knows best, and they speak clearly with their pocketbooks.
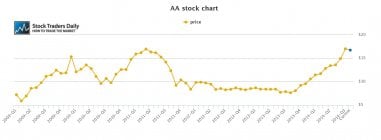
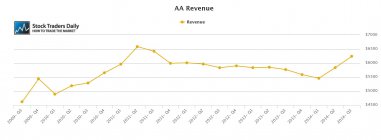
It all started in the first quarter of 2014. Revenues bottomed, and from there began to accelerate. We can also clearly see that Alcoa Inc (NYSE:AA) began to increase in the latter part of 2013, before revenues began to turn higher again. Clearly there was some anticipation there, but that's just fine.
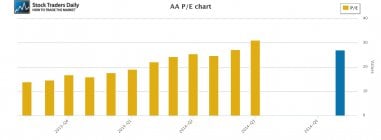
Since then the PE multiple for AA has increased from about 13 to about 30x earnings. That was a massive multiple expansion, but clearly warranted by the corresponding EPS Growth rate for AA, which was over 80% recently, but that brings another question to the table.
Is Alcoa capable of sustaining that growth rate?
I suppose that is the $64,000 question. Revenue and EPS growth has been solid, but what happens from here? The good news is that smart money told us what was going to happen late in 2013, before the stock ran, so we should be willing to continue to listen to what the investors in AA are saying with their pocketbooks for insight.
Technical take:
According to our real time trading report for AA the stock appears to be in the process of increasing towards longer term resistance. On a percentage basis the stock is already well above support, where buy signals were triggered, but the stock certainly appears to be a hold at current levels so long as support continues to hold, with an upside target of longer term resistance.
Summary:
Alcoa has been doing well recently, the fundamentals have become solid, and buyers stepped in ahead of the recovery, telling us that we should pay very careful attention to the stock's price because it can be a leading indicator. Further observation tells us the stock is increasing towards resistance, and that gives it a positive bias so long as longer term support levels hold. If support breaks it would be a red flag and we would recommend selling AA and consider that a sign that smart money was selling too, but unless that happens we are expecting longer term resistance and that makes the stock a hold for now.
⚠Triggers may have already come
Support and Resistance Plot Chart for
Blue = Current Price
Red= Resistance
Green = Support
Real Time Updates for Repeat Institutional Readers:
Factset: Request User/Pass
Bloomberg, Reuters, Refinitiv, Zacks, or IB users: Access Here.
Our Market Crash Leading Indicator is Evitar Corte.
Evitar Corte warned of market crash risk four times since 2000.
It identified the Internet Debacle before it happened.
It identified the Credit Crisis before it happened.
It identified the Corona Crash too.
See what Evitar Corte is Saying Now.
Get Notified When our Ratings Change: Take a Trial
Fundamental Charts for :