Predictive AI
Adds Alpha, Reduces Beta, Controls Risk
Valuation analysis for Chevron Corporation (NYSE:CVX)
This valuation analysis is the fifth in a series of reports that will at its end cover all 30 of the DJIA components. The goal of these combined reports is to paint a clearer picture of the current valuation of the DJIA as that related directly to earnings growth and relative PE. The raw data and all charts and graphs for these reports are already available to subscribers of Stock Traders Daily.
Chevron Corporation (NYSE:CVX) has had a negative PEG ratio since Q3 2012, both EPS and Revenue Growth has been negative, but the stock is up by about 17% since then. Clearly the stock has not surging by most definitions, but it is curious to watch a stock price increase so solidly when the underlying Earnings and Revenue of the company deteriorate.
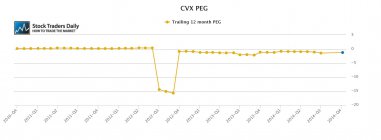
Are analysts expecting something more from CVX? The answer is no. Analysts are not expect much growth at all, and some are expecting continued negative growth as well, so the strength int he stock is definitely not supported by the underlying business operations.
However, one thing has increased since Q3 2012, when the PEG first turned negative, and that is the PE Multiple. Specifically, the PE multiple for CVX moved from near 7x to near 13x recently, and it currently is near 11x. Multiple expansion is absolutely the reason CVX has increased, the growth is not due to underlying strength in the business, and most likely not based on defined future growth either.
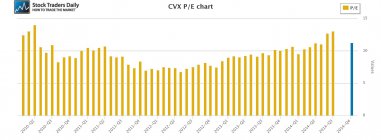
It could be safely surmised that CVX has been a direct beneficiary of FOMC stimulus, and the free money that has been chasing stocks over the past 18 months. When investors buy the DOW, they tend to do it using ETFs, and that means CVX gets inflows even when operations are deteriorating. This should be a red flag to everyone because the FOMC will officially stop buying bonds at its next meeting.
With that said, there is really only one thing that should matter to investors in CVX, and that's price. Clearly the operations matter but if operations are solid price should be too, so by watching the price of the stock we learn something about the business. In this case the findings are appropriate.
Technical Take:
According to our real time trading report for CVX the stock is currently below longer term support, it has recently broken, and if it stays broken we would expect material declines because there are no additional support levels in our report.
Summary:
The breaks in CVX technically support the fundamental weakness in the operations of the company and the risk associated with the changing FOMC policy. Multiple contraction is absolutely possible and a multiple closer to 7x is not out of the question.
⚠Triggers may have already come
Support and Resistance Plot Chart for
Blue = Current Price
Red= Resistance
Green = Support
Real Time Updates for Repeat Institutional Readers:
Factset: Request User/Pass
Bloomberg, Reuters, Refinitiv, Zacks, or IB users: Access Here.
Our Market Crash Leading Indicator is Evitar Corte.
Evitar Corte warned of market crash risk four times since 2000.
It identified the Internet Debacle before it happened.
It identified the Credit Crisis before it happened.
It identified the Corona Crash too.
See what Evitar Corte is Saying Now.
Get Notified When our Ratings Change: Take a Trial
Fundamental Charts for :