Predictive AI
Adds Alpha, Reduces Beta, Controls Risk
Valuation analysis for Cliffs Natural Resources Inc (NYSE:CLF)
Should you be buying beaten down out of favor companies and hope they turn around? If you do what should you look for, do you wait for things to look good again, or do you simply jump in?
Our evaluation of fair value for Cliffs Natural Resources Inc (NYSE:CLF) reveals opportunity for traders and concern for investors. We will begin with a fundamental observation, then offer technical observations, and then summarize our findings.
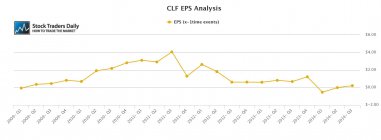
First, earnings peaked in the third quarter of 2011 at near $4.00 per share, but since then declined and recently fell into negative territory. The company managed to get earnings positive again in the recent quarter, but the trajectory of earnings is absolutely a concern.
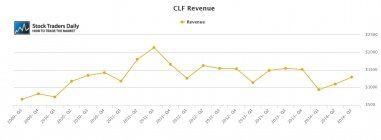
The same is true for revenue. In fact, the trend line for revenue is very similar to the trend line for earnings for CLF, and although the direction of both is therefore concerning, it is a welcome sign to see a relationship that is parallel when observing companies like this. If nothing more it makes the observation more concrete.
To be even more exact, however, we also have provided an earnings growth chart. Our EPS analysis combines trailing 12 month data on a yearly basis to define yearly growth. We exclude onetime events to better identify earnings from operations, and our analysis tells us, as you might surmise, that trailing 12 month earnings growth is about -34%. This is not good news for investors.
Technical observations:
According to our real time trading report for CLF the stock has recently tested longer term support and it seems to be in the process of increasing towards longer term resistance. On a percentage basis the stock is already quite a bit higher than our defined support level, but it is facing an intra channel level of resistance that will need to break higher too in order for the stock to continue to move higher to test our longer-term resistance level. Currently, the stock seems to be in the process of moving from longer term support towards longer term resistance.
Summary:
CLF is not attractive on a fundamental basis at this time, but if the company manages to stabilize the decline in earnings and continues to show a parallel relationship between earnings and revenue, suggesting that revenue would increase as well, the future growth rate of CLF has the potential to look outstanding given the awful results that followed the third quarter of 2011. To put that another way, it is much easier to grow on a percentage basis when EPS is 21¢ vs. $4.00.
The best time to buy stocks like this are on the heels of material weakness, and arguably that is exactly what has happened recently, but the stock would need to increase slightly more, beyond the intra channel resistance level we have identified in our real time trading report, for us to suggest that a progression towards longer term resistance continue. The optimal buying opportunity is at longer term support and the stock already tested and bounced from support, and is in the middle of its trading channel at this time. We would be cautious and disciplined because the stock has the potential to move aggressively.
⚠Triggers may have already come
Support and Resistance Plot Chart for
Blue = Current Price
Red= Resistance
Green = Support
Real Time Updates for Repeat Institutional Readers:
Factset: Request User/Pass
Bloomberg, Reuters, Refinitiv, Zacks, or IB users: Access Here.
Our Market Crash Leading Indicator is Evitar Corte.
Evitar Corte warned of market crash risk four times since 2000.
It identified the Internet Debacle before it happened.
It identified the Credit Crisis before it happened.
It identified the Corona Crash too.
See what Evitar Corte is Saying Now.
Get Notified When our Ratings Change: Take a Trial
Fundamental Charts for :