Predictive AI
Adds Alpha, Reduces Beta, Controls Risk
Valuation analysis for E I Du Pont De Nemours And Co (NYSE:DD)
This valuation analysis is the sixth in a series of reports that will at its end cover all 30 of the DJIA components. The goal of these combined reports is to paint a clearer picture of the current valuation of the DJIA as that related directly to earnings growth and relative PE. The raw data and all charts and graphs for these reports are already available to subscribers of Stock Traders Daily.
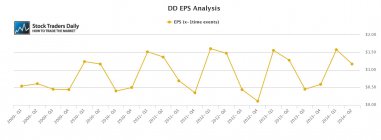
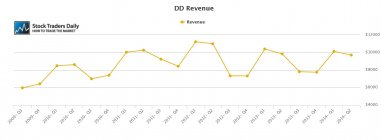
E I Du Pont De Nemours And Co (NYSE:DD) had a very weak Q4 2012 and that is making the comps pretty easy right now. Our Yearly trailing 12 month earnings growth cart shows a growth rate of about 11% from DD, but the stock has not really been growing that rapidly and the revenues have actually been flat lining.
A more rational look at EPS growth is found in the Quarterly Trailing 12 month comparison, which shows a slightly negative rate of growth instead.
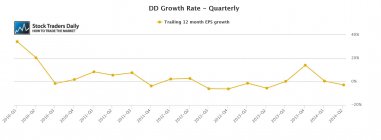
The interesting part is that this slow rate of growth is not being reflected in the stock's price. The company is not growing meaningfully and this is crystal clear when we look at the EPS and Revenue Trends, more clear when we look at Quarterly Trailing 12 month comparisons, but what is not clear is that the Trailing Yearly comparisons will also adjust to show much slower growth once the Q4 2012 data is no long part of the comparison. That means we should expect the yearly growth rate numbers to fall significantly after the Q4 2014 report unless a surprising spike in EPS and Revenue occurs.
The answer to that is they are! Analysts are expecting EPS growth of double digits over the next year, and although the past has not shown any growth, they clearly are expecting growth in 2015 to accelerate. If that is true the multiple of 18x that is levied on this stock right now may be more warranted, but if that does not happen the 18 multiple will seem very rich.
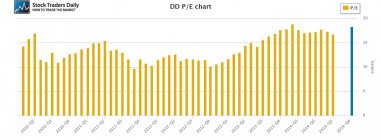
Therefore, it all rests on next year's results according to our EPS and valuation analysis.
Technical Take:
According to our real time trading report for DD the stock appears to be in the process of declining from longer term resistance towards longer term support, and that opens the door for a meaningful decline, but if that happens it need not change the growth expectations of analysts.
Summary:
Our analysis suggests that there is risk to the expectations of analysts next year given the past results, but even if those are solid the 18 multiple is rich and a natural oscillation from resistance to support could take place and already seems to be taking place.
⚠Triggers may have already come
Support and Resistance Plot Chart for
Blue = Current Price
Red= Resistance
Green = Support
Real Time Updates for Repeat Institutional Readers:
Factset: Request User/Pass
Bloomberg, Reuters, Refinitiv, Zacks, or IB users: Access Here.
Our Market Crash Leading Indicator is Evitar Corte.
Evitar Corte warned of market crash risk four times since 2000.
It identified the Internet Debacle before it happened.
It identified the Credit Crisis before it happened.
It identified the Corona Crash too.
See what Evitar Corte is Saying Now.
Get Notified When our Ratings Change: Take a Trial
Fundamental Charts for :