 pool ads
Valuation analysis for Exelon Corporation (NYSE:EXC)
Stock that have fallen in price are not necessarily good buys, in fact some stocks fall even further after declining modestly. It is important to indentify fair value as a result. This article identifies the fair value Exelon Corporation (NYSE:EXC) using an earnings driven approach. Our focus is on earnings and earnings growth in particular and we use that in association with the PE multiple to gauge fair value on a peg ratio basis. Our analysis excludes onetime events to identify truer growth rates, it encompasses complete earnings cycles to remove seasonal anomalies, and it looks ahead two years but not beyond two years because our assessments of analysts' expectations suggest that expectations change dramatically over multiyear time frames, they changed dramatically over quarters sometimes as well, so looking out beyond two years is often unreliable in our opinion.
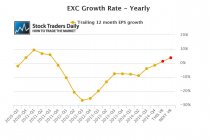
According to our earnings growth chart Excelon has been recovering from very negative earnings growth rates and although earnings growth was still -1.65% as of the last earnings release that was a significant improvement to the contractions that have been taking place.

In addition, the forward looking estimates suggest that Exelon will likely get back into the black. The first red dot in our earnings growth chart represents analysts' expectations for calendar 2015, and if they are right Exelon will grow by about 1.24%, and continue to grow by 3.77% by the end of calendar 2016 if analysts are right about their estimates for that year as well. That is certainly an improvement, but not mind boggling growth by any means.
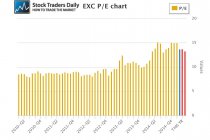
Now the PE multiple comes into play. The current multiple is 13.75, represented by the blue bar in our PE chart, the multiple at the end of 2015 is the same if analysts are right and price remains the same (firsr red bar), but the PE multiple declines slightly to 13.25 (second red bar) if analysts are right about their earnings estimates for calendar 2016 and price remains the same.

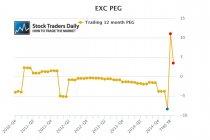
This allows us to combine yearly earnings growth and the PE multiple to define current and future valuation metrics using a peg ratio approach. Because the yearly growth rate as of the most recent quarter is negative the peg ratio is currently negative, but it will turn positive this year if analysts are correct about their earnings estimates for calendar 2015. The problem is that the peg ratio for Excelon will increase to 11.09 (first red dot) by the end of 2015 if price remains the same, and although it will look a little better by the end of 2016 the peg ratio will still be 3.51 (second red dot). Our identification of fair value using a peg ratio evaluation suggests that fair value exists when peg ratios are between 0 and 1.5 and Excelon does not have a peg ratio that will be in that range anytime soon.

So should the price of the stock remain the same, increase, or decline?
For value oriented investors there is no value in shares of Excelon at these levels. Only if earnings were expected to grow quite a bit faster than they are expected to grow now would that change, or if price declined significantly that would change our identification of value as well, but as things stand right now there's no value in shares of Excelon at these levels.
In conjunction with our real time trading report for EXC, there could be an opportunity for traders in this stock, but value oriented investors should avoid it. The stock runs the risk of deteriorating during calendar 2015 unless material events surface that no one is currently expecting.
However, even if something material happens to surface the stock would probably still be appropriate only for speculative investors and not for value oriented investors. Value oriented investors should avoid this stock.
Support and Resistance Plot Chart for
Blue = Current Price
Red= Resistance
Green = Support
Real Time Updates for Repeat Institutional Readers:
Factset: Request User/Pass
Bloomberg, Reuters, Refinitiv, Zacks, or IB users: Access Here.
Our Market Crash Leading Indicator is Evitar Corte.
Evitar Corte warned of market crash risk four times since 2000.
It identified the Internet Debacle before it happened.
It identified the Credit Crisis before it happened.
It identified the Corona Crash too.
See what Evitar Corte is Saying Now.
Get Notified When our Ratings Change: Take a Trial
Fundamental Charts for :