Valuation analysis for General Electric Company (NYSE:GE)
Our valuation analysis for General Electric Company (NYSE:GE) concentrates on earnings growth. However, given the circumstances at hand revenue trends must also be recognized. Our quant work is demonstrated here but additional fundamental research is not. This is a no-frills look at the raw numbers.
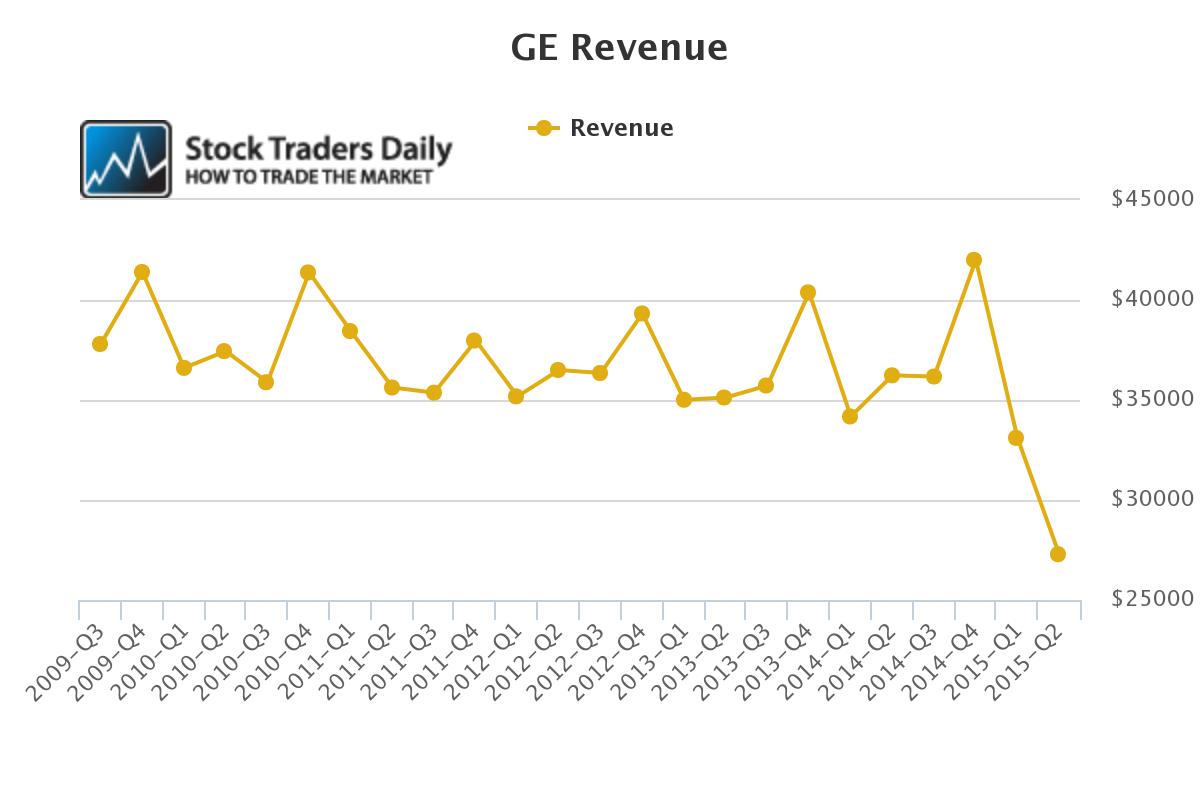
To begin, GE has seen significant quarterly revenue deterioration in recent quarters. Clearly this needs to stop, and most analysts think it will. The problem is that revenues often play a material role in earnings, and although some businesses may drain earnings the psychology of lower revenues presumes lower earnings will follow.

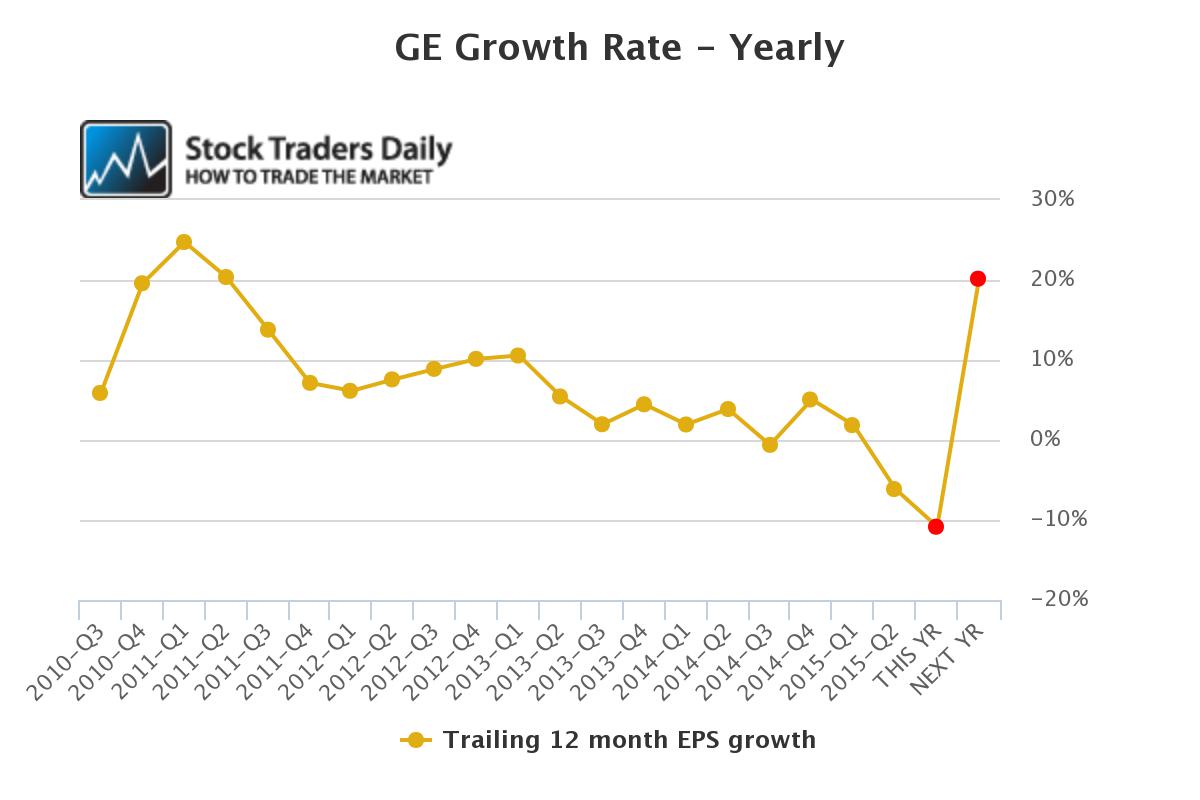
So far, that is exactly what has happened. EPS growth has been declining and is expected to be lower by 10.84% this year if analysts are right about their estimates. That is a material decline, represented by the first red dot in our chart, but the second red dot looks much better. That is a 2016 consensus projection and it implies that analysts are looking for a material positive shift in EPS growth in 2016.

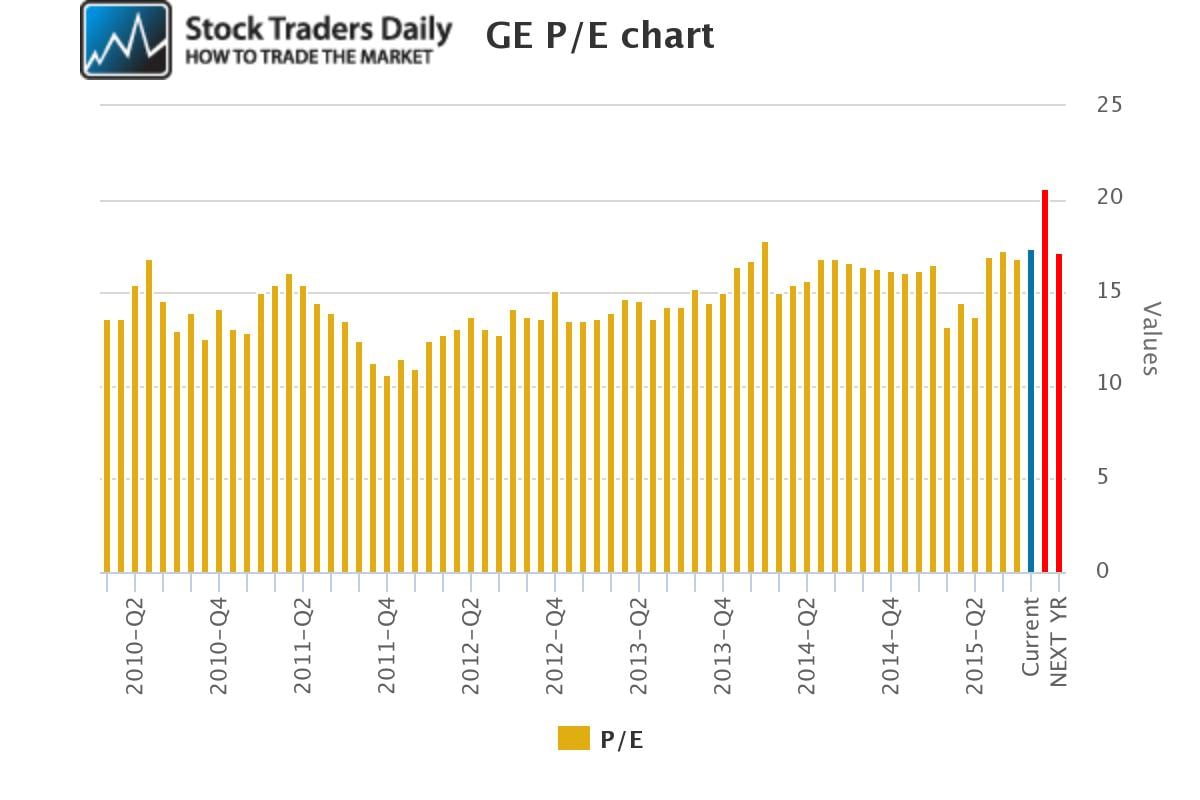
That brings our attention to the PE multiple, and our analysis shows that the PE for GE this year will increase to higher than it has been since 2009 (20.84). This is a major concern, rational given the negative EPS growth expected this year, but next year that is expected to change and the PE is expected to fall back to 17.18. The problem is that a multiple of 17x is still historically high for GE.

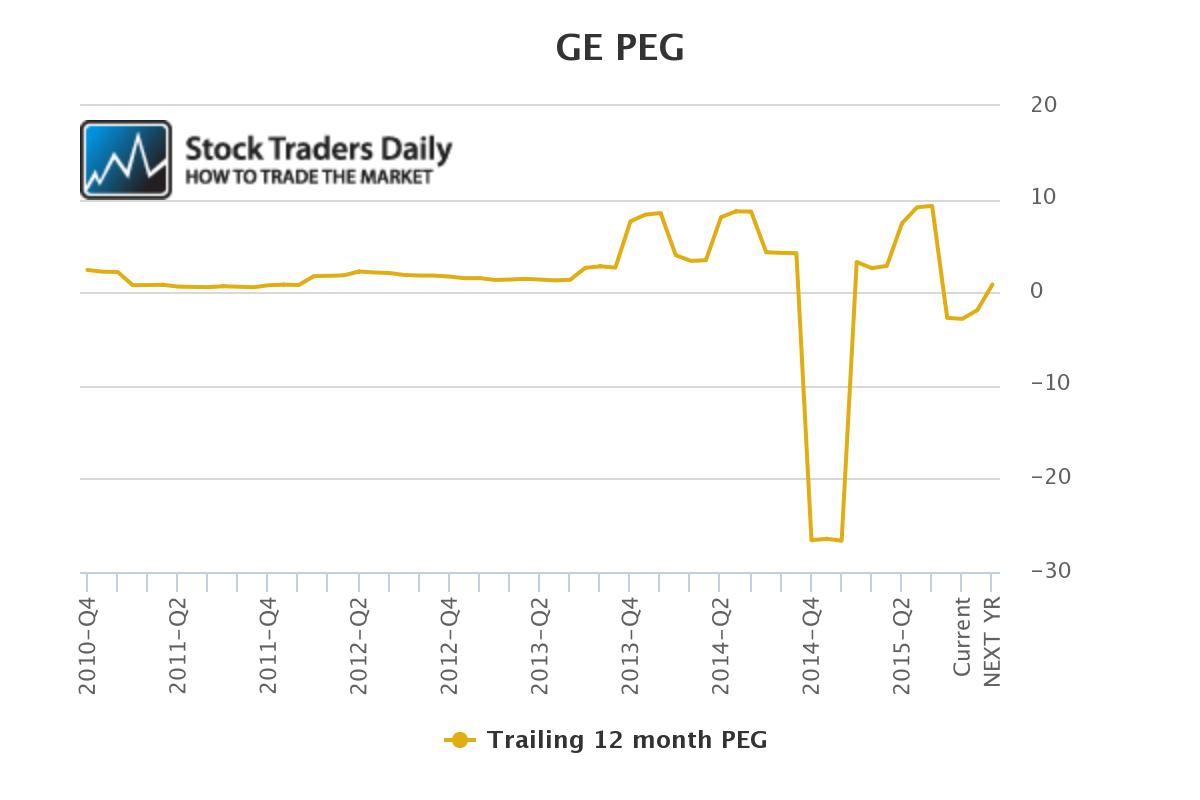
When we combine EPS growth and the PE to get the PEG ratio we can see that the current PEG is negative after being near 10, proving that EPS has been sporadic and valuation has been questionable recently, it will continue to be questioned through 2015 as well given the still negative projected PEG, but the PEG for 2016 looks great on the surface. It is only 0.84. Our identification of fair EPS-driven value suggests that a stock may look attractive with a PEG between 0-1.5 given normal circumstances.

However, what is happening at GE is not normal, and the turn that analysts expect in 2016, a 20% EPS growth rate over 2015, is not something they expect further out. That means that although the PEG ratio looks good at 0.84 for 2016, 2016 numbers will have easy comps vs. 2015.
If we normalize the comps it appears that a more realistic PEG going beyond 2016 is closer to 2 given the EPS and price data we have available today. If that changes our observations will surely change.
For now, we do not provide a current rating on shares of GE but if shares test the longer term resistance levels we have identified we will issue a Reduce - Sell rating on the shares. Right now our words of warning are that the stock looks rich immediately w/re to EPS growth, and the 2016 PEG is not realistic for valuation given the easy comps from 2015.
Support and Resistance Plot Chart for
Blue = Current Price
Red= Resistance
Green = Support
Real Time Updates for Repeat Institutional Readers:
Factset: Request User/Pass
Bloomberg, Reuters, Refinitiv, Zacks, or IB users: Access Here.
Our Market Crash Leading Indicator is Evitar Corte.
Evitar Corte warned of market crash risk four times since 2000.
It identified the Internet Debacle before it happened.
It identified the Credit Crisis before it happened.
It identified the Corona Crash too.
See what Evitar Corte is Saying Now.
Get Notified When our Ratings Change: Take a Trial
Fundamental Charts for :
