 pool ads
Valuation analysis for Intel Corporation (NASDAQ:INTC)
Every Day Stock Traders Daily will issue analysis like this before the EPS data is released.
If Intel manages to solidify expectations as those currently exist for calendar 2015 and 2016, we expect the stock to look attractive on a valuation basis and attract new money accordingly.
Analysts are expecting Intel Corporation (NASDAQ:INTC) to report EPS of $0.41 per share when it reports on Tuesday. If they are right, the quarterly growth rate as we defined it will increase to 7.3%, while the yearly growth rate will be 23.76%.
Our definition of earnings growth entails complete earnings cycles to avoid seasonal anomalies and we exclude onetime events to better define growth.
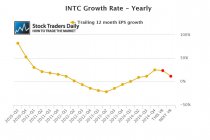
In our yearly growth chart below we can see that the earnings growth rate for Intel troughed in the second quarter 2013 and has been steadily increasing since then. As of the last quarter earnings growth was 25.27%, and if analysts are right about their expectations for 2015 earnings growth will be 23.76%, represented by the first red dot in our chart. The second red dot represents what analysts are expecting for calendar 2016, and that's 11.59%.
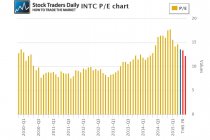
Now, our attention turns to the PE multiple. The multiple has been declining steadily since late last year when it reached 17.82, and it is now 13.68 as defined by the blue bar in our graph. The first red bar in our graph represents what the PE multiple would be if analysts are right about their expectations for calendar 2015 and price remains the same, that's 13.68, while the second red bar represents 2016 data and is 12.26 respectively, suggesting that the PE multiple will likely come down if analysts are correct and price remains the same.
This combination of earnings growth and PE multiples allow us to define value using a peg ratio approach. Our definition of fair value is when a company is trading with a peg ratio between zero and 1.5. Our peg ratio analysis shows us that the peg ratio for JP Morgan stretched beyond 1.5 in the early part of 2014, and since then the peg ratio has been negative. The blue dot in our graph shows us that the current peg ratio is -2.11, the first red dot shows us what the peg ratio would be if analysts are right about 2015, that is ugly, but if analysts are right and JP Morgan gross earnings by 21.55% in 2016 the peg ratio will fall right into our wheelhouse. The second red dot represents a peg ratio of 0.45.
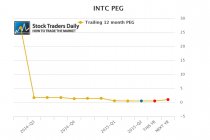
This combination of earnings growth and PE multiple evaluation allows us to define peg ratios. Peg ratios in turn help us define fair value and according to our observations fair value exists when a peg ratio is between zero and 1.5. Our peg ratio chart for Intel shows us that peg ratios were stretched and valuation therefore was stretched through the first half of 2014, then the peg ratios came down to much more reasonable levels. Intel currently trades with a peg ratio of 0.58, defined by the first blue dot in our peg ratio chart, and if analysts are right about their estimates for calendar 2015 the peg ratio will be 0.57, the first red dot. The second red dot represents calendar 2016 if analysts are right and price remains the same, and that's 1.06. All of these are in our wheelhouse.
As a result, we would consider Intel to be relatively attractive on a valuation basis. If analysts are right and price remains the same the valuation metrics will improve for Intel over time, and if valuation becomes more attractive we would also expect price to increase accordingly. That means, on a fundamental basis, Intel looks relatively attractive given the earnings growth expectations that currently exists, even though earnings growth expectations for 2016 are not as high as they are for 2015.
Furthermore, our Trading Report for INTC tells us that Intel recently tested a level of longer term support which acted as a buy signal, so our combined analysis tells us to expect the stock to trend higher on a near term basis as well.
Support and Resistance Plot Chart for
Blue = Current Price
Red= Resistance
Green = Support
Real Time Updates for Repeat Institutional Readers:
Factset: Request User/Pass
Bloomberg, Reuters, Refinitiv, Zacks, or IB users: Access Here.
Our Market Crash Leading Indicator is Evitar Corte.
Evitar Corte warned of market crash risk four times since 2000.
It identified the Internet Debacle before it happened.
It identified the Credit Crisis before it happened.
It identified the Corona Crash too.
See what Evitar Corte is Saying Now.
Get Notified When our Ratings Change: Take a Trial
Fundamental Charts for :