Valuation analysis for Intel Corporation (NASDAQ:INTC)
Our valuation analysis for Intel Corporation (NASDAQ:INTC) concentrates on earnings growth to properly determine fair value. We are not addressing fundamental company based developments or the industry in this quant-driven observation, but instead using the raw numbers to draw conclusions.
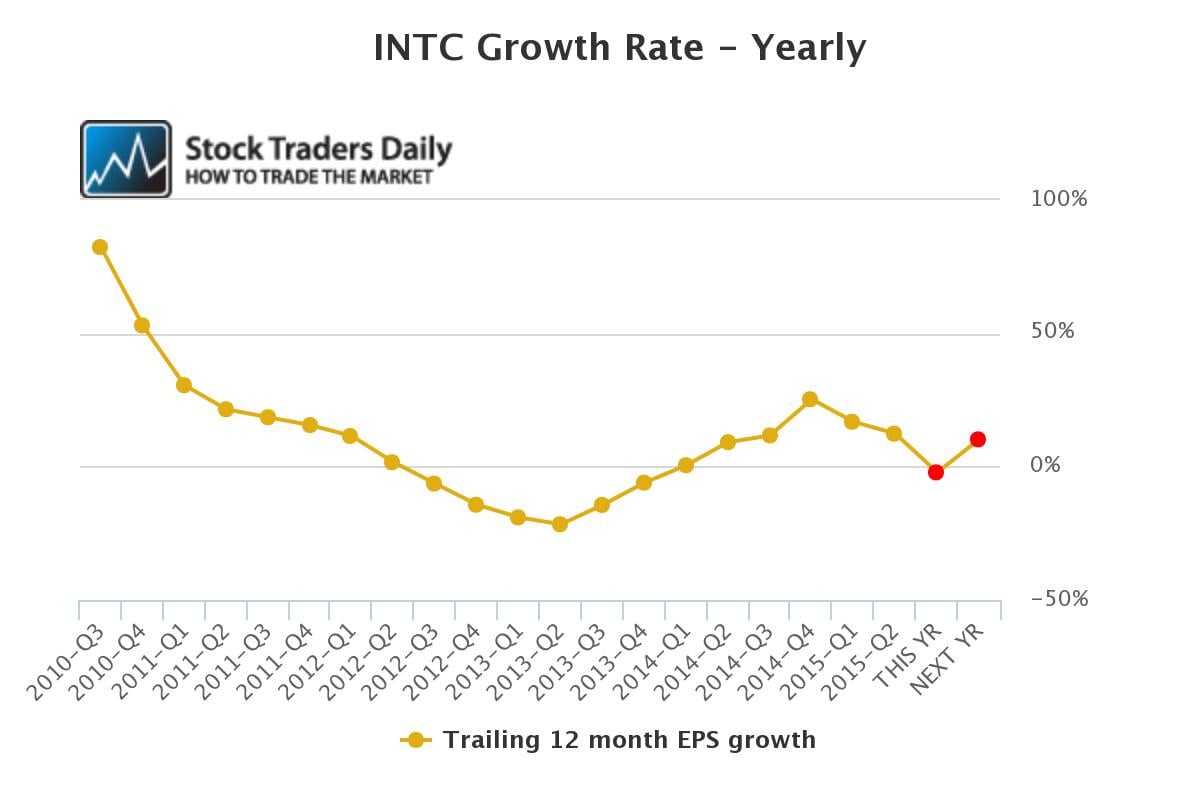
To begin, we all can see that EPS growth for INTC had been falling, the declines from 2010-2013 were aggressive, but in the middle of 2013 there seems to have been a trough in the EPS growth deterioration and recovery was seen. The patterns seem to suggest that stabilization now is taking place after what were very easy comps allowed recovery to look impressive in 2014.

In Calendar 2015 EPS growth is expected to be negative, lower by 2.3% from the prior year, but in 2016 that is expected to change favorably and EPS growth of over 10% is expected. Given the stabilization that seems to have already taken place we believe that a growth rate of 10% is reasonable and in line with forward projections.
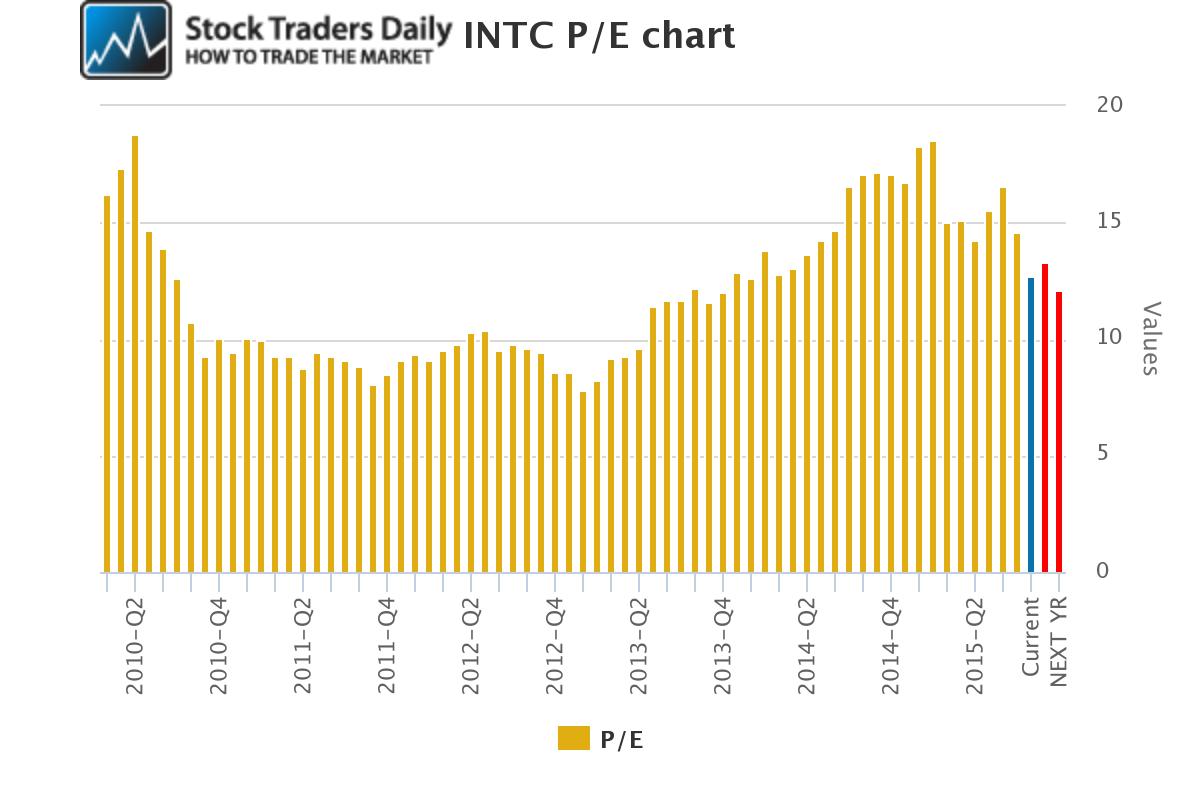
The PE multiple has come down from late 2014 as well, it is currently 12.86, and is expected to fall to 12.21 in 2016 if analysts are right about their estimates and price remains the same. Although a 10x multiple would be ideal, a 12x multiple is not bad for INTC given its expected 10% growth rate.

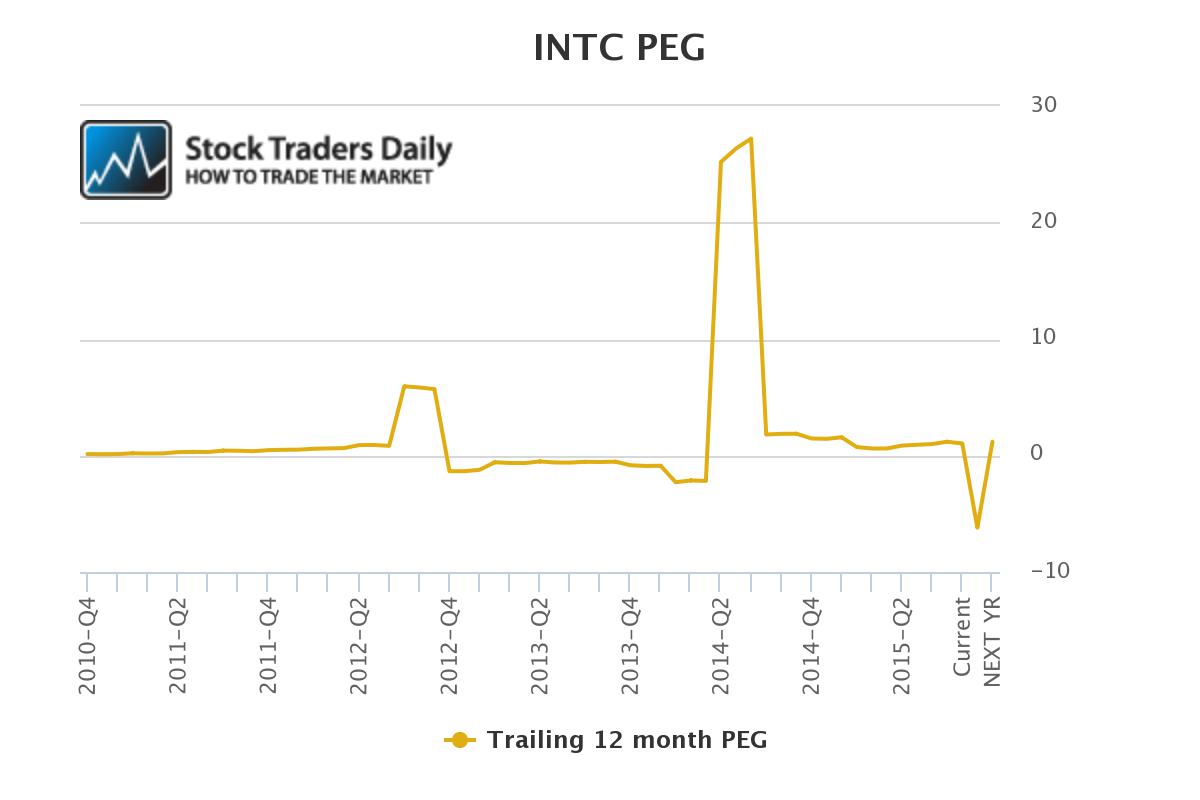
According to our PEG ratio evaluation of EPS growth and PE the stabilization in fair value after 2013 becomes clearer, with an obvious undulation in calendar 2015. Looking ahead though, the 2016 PEG ratio is 1.19, which represents a decent fair value according to our observations.

The problem is that shares of INTC have not yet fallen enough for us to be buyers. They are getting closer, and if the stock falls to our stated longer term support levels we anticipate issuing a buy rating on shares of INTC, but not at this time. We are patient and looking for a solid entry level.
Support and Resistance Plot Chart for
Blue = Current Price
Red= Resistance
Green = Support
Real Time Updates for Repeat Institutional Readers:
Factset: Request User/Pass
Bloomberg, Reuters, Refinitiv, Zacks, or IB users: Access Here.
Our Market Crash Leading Indicator is Evitar Corte.
Evitar Corte warned of market crash risk four times since 2000.
It identified the Internet Debacle before it happened.
It identified the Credit Crisis before it happened.
It identified the Corona Crash too.
See what Evitar Corte is Saying Now.
Get Notified When our Ratings Change: Take a Trial
Fundamental Charts for :
