 pool ads
Valuation analysis for JPMorgan Chase & Co. (NYSE:JPM)
This is the fifteenth DJIA based analysis provided publicly by Stock Traders Daily. Based on analysis already provided to clients, Stock Traders Daily is making its views public, one by one, and will conclude with a fair valuation analysis of the DJIA.
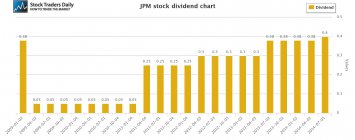
Investors in JPMorgan Chase & Co. (NYSE:JPM) are very happy because the stock pays a decent dividend again, at about 2.7%, but our observation of earnings and revenue growth could concern investors who are interested in seeing that dividend grow. Of course, concerns about earnings and revenue growth would also concern investors who are in the stock for capital appreciation as well.
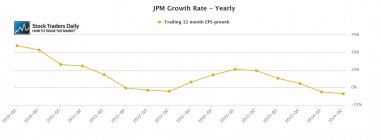
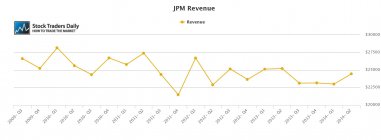
Our evaluation of earnings growth excludes onetime events so as to better identify earnings growth from operations. Our analysis comprises trailing 12 month data for every quarter and when we observe this data for JP Morgan we actually see that earnings growth on a yearly basis is negative. That is a big concern for investors and although revenue increased on a Q/Q basis last time, over the past few years revenues have done nothing more than flat line.
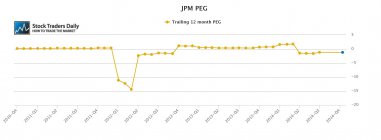
In addition, although the valuation ratios for JP Morgan have not looked good for years, I am specifically talking about PEG ratios, we believe the best time to buy shares of JPMorgan based on a historical trailing 12 month peg ratio analysis is when the peg ratio collapses by double digits like it did in the second quarter of 2012.
Technical take:
According to our real time trading report for JP Morgan the stock recently came very close to longer term resistance and it has already begun to pull back. Although the stock could increase some from current levels because it has already moved down some from resistance, it has not tested support yet and we would not be buyers until such time as the stock tests longer term support again.
Summary:
Growth concerns exist at JPM and although the stock does not look rich on a relative PE basis alone it certainly is not attractive on a valuation basis at this time and the stock has already tested longer term resistance to boot. In our opinion JPM has room to fall as a result and we would not be buyers at these levels even after the recent pullback.
Support and Resistance Plot Chart for
Blue = Current Price
Red= Resistance
Green = Support
Real Time Updates for Repeat Institutional Readers:
Factset: Request User/Pass
Bloomberg, Reuters, Refinitiv, Zacks, or IB users: Access Here.
Our Market Crash Leading Indicator is Evitar Corte.
Evitar Corte warned of market crash risk four times since 2000.
It identified the Internet Debacle before it happened.
It identified the Credit Crisis before it happened.
It identified the Corona Crash too.
See what Evitar Corte is Saying Now.
Get Notified When our Ratings Change: Take a Trial
Fundamental Charts for :