 pool ads
Valuation analysis for Johnson & Johnson (NYSE:JNJ)
Stock Traders Daily is in the process of releasing its findings of Fair Market valuation by publicly illustrating the fair value of the 30 stocks that comprise the DJIA, one by one. Using analysis and data already provided to clients, this is the sixteenth of the 30 public analyses.
Our valuation analysis of Johnson & Johnson (NYSE:JNJ) begins with an evaluation of earnings growth, and earnings growth has been solid. Johnson &Johnson is not typically known as a company that grows earnings quickly, it is a more slow but steady stock, at least in the eyes of Wall Street. However, recently the company has demonstrated an ability to grow earnings quite rapidly, at least rapidly for Johnson &Johnson, and according to our yearly trailing 12 month growth observation the stock is growing earnings at a rate that is greater than 6%.
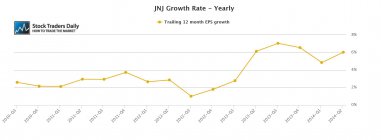
In addition, and something that is extremely important for investors who are looking for sustainable earnings growth, revenues are growing as well. The combination of earnings and revenue growth adds credibility to the Johnson &Johnson story.
However, the stock also trades at a multiple that looks relatively expensive compared to that relatively tame earnings growth rate. At 17.4x earnings, earnings growth would need to accelerate beyond 6% for fair valuation to be on par with the current stock price, and interestingly, over the next 12 months analysts do expect earnings growth to ramp up. The problem is they only expect it to ramp up to about 8%, and the stock still trades over 17x earnings.
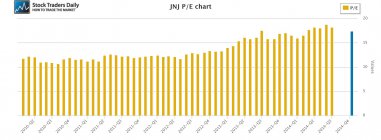
This brings the peg ratio into focus and according to our peg ratio analysis the stock is trading with a peg ratio that is 2.89. That suggests the stock has priced in the current growth rate and more already, and for investors looking for stock price appreciation based on fair value analysis, Johnson &Johnson does not look to be undervalued at these levels, it actually looks rich with forward expectations already built in, and that poses some concerns on a valuation basis.
Technical take:
According to our real time trading report for Johnson &Johnson the stock has recently begun to break longer term support and so long as that is true we will expect lower levels. Breaks of longer term support are sell signals, and unless the stock reverses above these former levels of support, which have now been converted into resistance, our combined analysis tells us to expect relatively aggressive declines because there are no additional support levels in the stock at this time according to our report.
Summary:
Although Johnson &Johnson has been growing at a nice rate given its typical annualized growth rate the stock still appears rich on a valuation basis, it has broken longer term technical support levels, and it looks like an avoid at this time. The stock has room to decline if it stays under former longer term support (converted resistance) levels.
Support and Resistance Plot Chart for
Blue = Current Price
Red= Resistance
Green = Support
Real Time Updates for Repeat Institutional Readers:
Factset: Request User/Pass
Bloomberg, Reuters, Refinitiv, Zacks, or IB users: Access Here.
Our Market Crash Leading Indicator is Evitar Corte.
Evitar Corte warned of market crash risk four times since 2000.
It identified the Internet Debacle before it happened.
It identified the Credit Crisis before it happened.
It identified the Corona Crash too.
See what Evitar Corte is Saying Now.
Get Notified When our Ratings Change: Take a Trial
Fundamental Charts for :