 pool ads
Valuation analysis for Merck & Co., Inc. (NYSE:MRK)
This is the 18th in a series of public valuation reports in aimed at identifying the fair value of the Dow Jones industrial average. Stock Traders Daily is releasing these reports one by one to the public in an effort to reveal information already shared with clients of stock traders daily. The objective is to identify what the fair value of the Dow Jones industrial average is so that investors can manage their risk appropriately.
When evaluating companies for fair value on a fundamental basis we look at earnings growth. In the case of Merck & Co., Inc. (NYSE:MRK), earnings growth deteriorated from the second quarter of 2012 and it has been flat lining, so to speak, since then. Earnings growth was dismal prior to the recent quarter, but because the comps from the second quarter of 2012 were no longer in the equation the trailing 12 month earnings growth observations included in the chart below show us that mark actually grew by about 2.63% from the previous year.
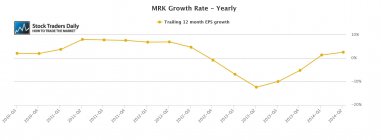
The interesting thing is the stock price increased aggressively from the second quarter of 2012, almost exactly as earnings growth deteriorated. When looking at the stock on a fundamental basis we can see that the rationale for the increase was purely multiple expansion. The PE multiple for mark increased from near nine times earnings to over 16 times earnings between the second quarter of 2012 and now, while earnings deteriorated.
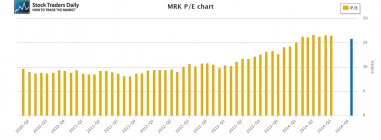
This causes a serious skew to valuation metrics. Using a peg ratio valuation analysis we can see that work traded with a peg ratio just over 1 before the earnings collapse in the second quarter of 2012, and then the peg ratio chart went haywire. First, the peg ratio fell into negative territory, but then it skyrocketed and it currently rests at 6.05. For a company that is barely growing at all, one that is actually experienced both earnings and revenue contractions, a peg ratio of 6.05 makes it look extremely rich.
Technical take:
According to our real time trading report for Merck the stock has broken below longer term support and by rule we would expect the stock to decline aggressively from breaks of support. Our technical observations suggest that Merck has room to decline so long as it remains under former levels of support, which have now been converted to resistance.
Summary:
According to our observations work appeared to be the darling, a safe haven, and a place to pour money until recently. The contractions in earnings and revenue were being ignored and the multiple expansion that took place was completely unwarranted. Almost immediately as risks were being re-evaluated shares of Merck tumbled from resistance to support and then it broke support. Our observations suggest that smart money investors see no value in shares of Merck at this time and consider the stock to be a high risk given the multiple that exists when compared to the growth rate.
Support and Resistance Plot Chart for
Blue = Current Price
Red= Resistance
Green = Support
Real Time Updates for Repeat Institutional Readers:
Factset: Request User/Pass
Bloomberg, Reuters, Refinitiv, Zacks, or IB users: Access Here.
Our Market Crash Leading Indicator is Evitar Corte.
Evitar Corte warned of market crash risk four times since 2000.
It identified the Internet Debacle before it happened.
It identified the Credit Crisis before it happened.
It identified the Corona Crash too.
See what Evitar Corte is Saying Now.
Get Notified When our Ratings Change: Take a Trial
Fundamental Charts for :