Predictive AI
Adds Alpha, Reduces Beta, Controls Risk
Valuation analysis for Nike Inc (NYSE:NKE)
This is the 20th in a series of public analysis provided by Stock Traders Daily to help the general public understand the fair value of the Dow Jones industrial average. The data are referenced here has already been provided to subscribers of Stock Traders Daily's newsletter and data on more than 3000 companies is readily available, but by the time Stock Traders Daily has finished releasing its public observations it will conclude with a fair value analysis of the Dow Jones industrial average so investors who are not clients can manage risk appropriately too.
When we look at EPS and revenue trends for Nike Inc (NYSE:NKE) the trends certainly seem positive, so does the pattern of increasing dividends, but behind the scenes something is happening that normal investors are not paying attention to. Specifically, EPS growth rate for Nike has declined considerably.
Our analysis of EPS growth is based on trailing 12 month data that excludes onetime events to better identify earnings growth from operations. Over the past handful of years we saw earnings growth trough in the second quarter of 2012, and peak a year later in the second quarter 2013.
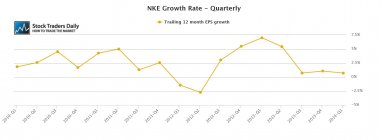
As we might expect, when earnings growth troughed in 2012 PE multiple for Nike also was at a relative trough. Relative, for Nike, the trough in its PE multiple back then was about 17x earnings. From that point, as earnings growth accelerated, so did the PE multiple and by the time the earnings growth peaked in the second quarter of 2013 a PE multiple was 25x.
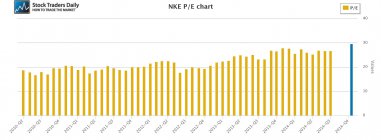
The fundamental concern that we have is that since the second quarter of 2013 earnings growth has fallen and it is almost back to where it was in the second quarter of 2012, but instead of declining back towards a trough the PE multiple has actually increased further and is very close to 30x. Nike is a company that analysts expect will continue to grow solidly, like it has in the past, but given where the stock is now in relation to current growth, including immediate expectations, the stock looks extremely rich. To put that into perspective, the peg ratio for Nike is over 11 and it has never been this high.
Technical take:
According to our real time trading report for Nike, the stock has recently tested longer-term resistance and it has begun to pull back. According to our report the stock is likely to continue to fall from resistance towards longer term support and as a result we would not be buyers of the stock at this level.
Summary:
According to our combined observations for Nike the stock is rich on a fundamental basis and instead of experiencing an appropriate valuation contraction when earnings growth declined the stock experienced multiple expansion and that was not appropriate. Given the fact that the stock has already tested longer-term resistance and it is already pulling back our summary observation is to expect further deterioration from shares of Nike.
⚠Triggers may have already come
Support and Resistance Plot Chart for
Blue = Current Price
Red= Resistance
Green = Support
Real Time Updates for Repeat Institutional Readers:
Factset: Request User/Pass
Bloomberg, Reuters, Refinitiv, Zacks, or IB users: Access Here.
Our Market Crash Leading Indicator is Evitar Corte.
Evitar Corte warned of market crash risk four times since 2000.
It identified the Internet Debacle before it happened.
It identified the Credit Crisis before it happened.
It identified the Corona Crash too.
See what Evitar Corte is Saying Now.
Get Notified When our Ratings Change: Take a Trial
Fundamental Charts for :