Predictive AI
Adds Alpha, Reduces Beta, Controls Risk
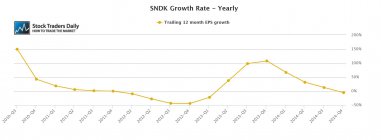
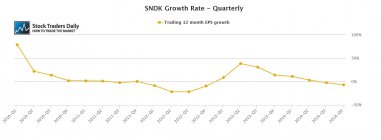
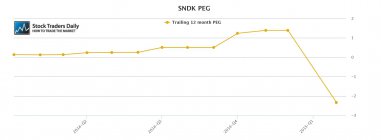
Valuation analysis for SanDisk Corporation (NASDAQ:SNDK)
Stock Traders Daily has covered its short position in SanDisk.
According to the rules that define the Stock of the Week Strategy (details) offered by Stock Traders Daily, SanDisk Corporation (NASDAQ:SNDK) and was selected as a short this week using a combination of market based analysis and correlation tools designed to select stocks that were likely to move with the market as the market moved.
Arguably, haphazard conditions existed all week given the earnings results that transpired, with apple as the most influential catalyst to SanDisk thus far. In addition, the pains offered on CNBC by Jim Cramer added to the downward pressure in SanDisk on Thursday.
However, the selection of SanDisk had nothing to do with earnings expectations from apple, anticipated negative feedback by Jim Cramer, but instead they were based on a combination of fundamental and technical factors that suggested that SanDisk would move with the market as the market fell this past week. The market did exactly that, and Stock Traders Daily has secured gains from that short position already.
Below is a raw valuation analysis of SanDisk:
Disclaimer: Stock Traders Daily provides trading strategies, which by definition incorporate risk controls, and it has only engaged in buy and hold strategies twice since the turn of the century. The first was in October of 2002, and those buy and hold strategies lasted until 2006, and the second was in February of 2009, and those buy and hold strategies lasted until the end of 2010. Every point in between Stock Traders Daily has been providing risk controlled strategies, market based strategies, and strategies for approximately 3000 individual stocks, which are unbiased and which incorporate the notion that short term gains lead to long term success. There is a time and a place for buy and hold strategies and this is neither the time nor the place for that approach in our opinion. Risk controls are essential.
⚠Triggers may have already come
Support and Resistance Plot Chart for
Blue = Current Price
Red= Resistance
Green = Support
Real Time Updates for Repeat Institutional Readers:
Factset: Request User/Pass
Bloomberg, Reuters, Refinitiv, Zacks, or IB users: Access Here.
Our Market Crash Leading Indicator is Evitar Corte.
Evitar Corte warned of market crash risk four times since 2000.
It identified the Internet Debacle before it happened.
It identified the Credit Crisis before it happened.
It identified the Corona Crash too.
See what Evitar Corte is Saying Now.
Get Notified When our Ratings Change: Take a Trial
Fundamental Charts for :