 pool ads
Valuation analysis for Southern Co (NYSE:SO)
This article identifies the fair value of Southern Co (NYSE:SO) using an earnings driven analysis that focuses on trailing 12 month earnings growth compared quarterly and plotted over time to define earnings trends. Our observation excludes onetime events to focus on truer growth rates while comparing PE multiples to those growth rates to define value accordingly.
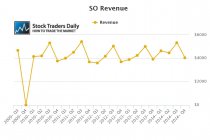
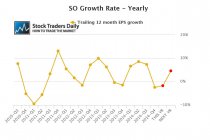
Our observation shows us that Southern has not been growing either earnings or revenue recently and in fact earnings growth has turned negative as of the most recent release. Our observations include complete 12 month cycles to dilute seasonality, but as we look ahead we can also see that analysts are expecting negative growth this year as well.
Currently, the earnings growth rate for Southern is -2.43%, and if analysts are right about their estimates for this year earnings will decline by 1.73% in 2015. Not until the end of 2016 will earnings get back in the black, according to analyst estimates, where earnings growth of 4.63% is expected.
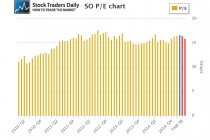
The current PE multiple for Southern is 16.5 times earnings, but if price remains the same and earnings come in as analysts expect the PE multiple will decline to 16.32 this year and to 15.77 next year. Arguably, the PE multiple is not likely to change much if analysts are correct and price remains the same.
However, what does stand out is the change that will occur in the peg ratio valuation analysis we have conducted. Currently, the peg ratio is -6.79, if analysts are right about this year the peg ratio will be -9.49, but looking ahead to 2016 the peg ratio for Southern will increase to 3.41 if analysts are correct.
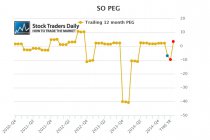
The problem here is that the definition of fair value using a peg ratio approach suggests peg ratios that are near 1.5 represent fair values for companies that are not in high growth industries. Arguably, southern is not in a high growth industry, so fair value based on earnings growth for Southern company is much less than what the value for southern will be at the end of 2016 if analysts are correct. There is, in fact, quite a wide margin between 3.41 and 1.5.
For investors the takeaway here is that there is no current value in shares of Southern at this time and instead the stock actually looks considerably rich when we compare it's PE multiple to its earnings growth rate. Investors looking for value should not consider Southern to be a value at this level.
Technical take:
According to our real time trading report for Southern the stock is testing longer term support and although the longer term trading channel is tight, our rules tell us to expect the stock to trade back towards longer term resistance if longer term support levels remain intact. Longer term support is currently $46.40, if the stock holds this support level we would consider it a buy, but if it breaks we would consider that an indication the stock could fall further and we would exit accordingly.
Summary:
Although there is no relative value in shares of Southern at this time the stock could be a buy for traders or more aggressive investors. Value oriented investors should avoid this stock.
Disclaimer: Stock Traders Daily provides trading strategies, which by definition incorporate risk controls, and it has only engaged in buy and hold strategies twice since the turn of the century. The first was in October of 2002, and those buy and hold strategies lasted until 2006, and the second was in February of 2009, and those buy and hold strategies lasted until the end of 2010. Every point in between Stock Traders Daily has been providing risk controlled strategies, market based strategies, and strategies for approximately 3000 individual stocks, which are unbiased and which incorporate the notion that short term gains lead to long term success. There is a time and a place for buy and hold strategies and this is neither the time nor the place for that approach in our opinion. Risk controls are essential.
Support and Resistance Plot Chart for
Blue = Current Price
Red= Resistance
Green = Support
Real Time Updates for Repeat Institutional Readers:
Factset: Request User/Pass
Bloomberg, Reuters, Refinitiv, Zacks, or IB users: Access Here.
Our Market Crash Leading Indicator is Evitar Corte.
Evitar Corte warned of market crash risk four times since 2000.
It identified the Internet Debacle before it happened.
It identified the Credit Crisis before it happened.
It identified the Corona Crash too.
See what Evitar Corte is Saying Now.
Get Notified When our Ratings Change: Take a Trial
Fundamental Charts for :