Predictive AI
Adds Alpha, Reduces Beta, Controls Risk
Valuation analysis for The Boeing Company (NYSE:BA)
This is the second in a Series of 30 reports that are focused on identifying the valuation of the Dow Jones Industrial Average. We have already identified combined earnings growth in our Earnings Evaluation Module offered to Members of Stock Traders Daily, but this Series of reports will compliment that by evaluating each company on an individual basis. These report will be issued publicly at a rate of three per day over the next 10 days, however, the data is all already available to subscribers.
The Boeing Company (NYSE:BA) has had stellar Earnings growth in recent years. The Company experienced Yearly Trailing 12 month Earnings growth, excluding 1-time events, of 21.3% in the most recent report, and it has been at or around that level for the prior four quarters as well. The company has been doing very well, but something odd exists in the valuation metrics.
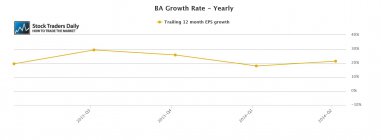
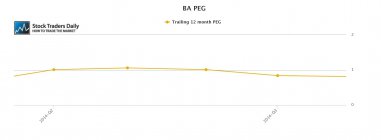
For a company growing this fast we would expect the PE multiple to reflect that growth rate if analysts expected the growth to be maintained, but that is not the case here. The PE multiple for BA is just over 16x, and that's surprising given the recent eye-popping growth. This tells us that either the company is significantly undervalued, or growth rates are expected to come down measurably. When we look closely at analyst's expectations, we can see that it is the latter.
Analysts are expecting slower growth from BA, and although the current PEG ratio is only 0.74, that is reflecting slower growth in the months ahead. In fact, based on consensus analysts' estimates BA is expected to grow by what seems to be a meager 4% rate (meager when compared to recent quarters), and if that is true the PEG ratio that exists now will adjust to that slower growth rate, and increase to as much as 4 assuming no change to the multiple. That would make BA look rich at current levels.
From a PE evaluation it certainly seems that the best time to buy BA is when the PE is closer to 13, which opens the door for a pullback of decent magnitude (multiple contraction is likely).
Technical Take:
According to our real time trading report for BA the stock tested longer term resistance a while ago and it has not yet declined to officially test longer term support. According to our analysis it is an avoid, which means it is not tradable long or short, but it does seem as if it will continue to decline to longer term support.
Summary:
BA appears to be a stock that would be very vulnerable to market decline if the market begins to pull back.
⚠Triggers may have already come
Support and Resistance Plot Chart for
Blue = Current Price
Red= Resistance
Green = Support
Real Time Updates for Repeat Institutional Readers:
Factset: Request User/Pass
Bloomberg, Reuters, Refinitiv, Zacks, or IB users: Access Here.
Our Market Crash Leading Indicator is Evitar Corte.
Evitar Corte warned of market crash risk four times since 2000.
It identified the Internet Debacle before it happened.
It identified the Credit Crisis before it happened.
It identified the Corona Crash too.
See what Evitar Corte is Saying Now.
Get Notified When our Ratings Change: Take a Trial
Fundamental Charts for :