 pool ads
Valuation at McDonalds Corporation (NYSE:MCD) Does Not Add Up
At Stock Traders Daily, we have provided earnings growth data for over 1300 companies, and from what we see there is a clear trend in the market today. Earnings growth rates for many companies have been deteriorating, but multiples have actually been expanding, and mathematically that does not add up.
What we're seeing from McDonald's Corporation (NYSE:MCD) in the current market environment largely represents what we're seeing from many larger companies in today's stock market. Shares of McDonald's are priced for growth, with a PE multiple over 15 times earnings after excluding onetime events. However, the yearly growth rate for McDonald's is zero, actually slightly negative, and that raises red flags.
When considering companies to invest in one of the material criteria is always earnings. We must understand not only the quality of those earnings but also the trend of earnings and specifically earnings growth. Given the quality of the company, McDonald's has been around forever, and for sake of this discussion, we are assuming that the quality of the earnings at McDonald's is the same as it has been historically. Whether that comes from healthier foods or traditional hamburgers is irrelevant to this discussion, but it clearly plays a role in the perception for future demand.
With earnings in focus, and with the admonition that earnings growth is of equal quality, our attention turns two earnings growth. In evaluating earnings growth we do so using two metrics, one is an evaluation of quarterly earnings growth and the second is an evaluation of yearly earnings growth. In each case we take trailing 12 month earnings and combined them to get our data points for each quarter respectively. In the quarterly earnings growth calculation we compare trailing 12 month data for the current quarter to the trailing 12 month data for the previous quarter and plot that data on a graph over time to see the trend in quarterly earnings growth. The same data is used in the yearly earnings growth chart, plotted in a similar way, but in that chart we compare the current quarter to the same quarter of the previous year to evaluate yearly earnings growth.
Historically, we have found the yearly earnings growth data to be much more important than the quarterly earnings growth data, even though each one takes into account a complete 12 month cycle. With a focus on the yearly earnings growth for McDonald's we can see that the company has experienced a steady decline in earnings growth from the second quarter of 2010, and just recently earnings growth has become slightly negative at -0.18%.
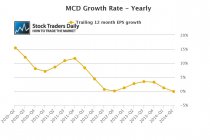
During this time the PE multiple for McDonald's has actually gone up slightly. Arguably, the 15% earnings growth that the company was experiencing back in 2010 was impressive, but with earnings growth now negative something very important must be considered.
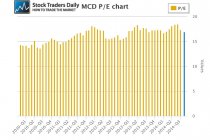
If McDonald's is not growing earnings and earnings are an integral part of the evaluation we make when we determine whether or not to buy a stock, should we be willing to pay 17 times earnings for MCD?
For help in identifying the answer to that question we look to our technical observations and our combined technical analysis for MCD suggests that McDonald's has recently begun to break below longer term support and that is a red flag. That tells us that the stock not only has declined to test longer term support, but longer term support is not currently holding and that tells us that the stock can continue to fall.
When the fundamental observations are combined with the technical observations for McDonald's concerns are obvious, but for many of the stocks in the market today those concerns are not as obvious yet. Many of the stocks in the market today are experiencing similar deteriorating earnings growth rates, but the deterioration for many of them has largely gone unnoticed. In fact, I would argue that the deterioration in yearly earnings growth for McDonald's has also gone unnoticed even after the recent concerns. Instead, novice investors like to compare current quarter data to the same quarter of the previous year, but that does little to provide light on trailing 12 month yearly growth rates and significant skews can occur when that approach is taken.
Support and Resistance Plot Chart for
Blue = Current Price
Red= Resistance
Green = Support
Real Time Updates for Repeat Institutional Readers:
Factset: Request User/Pass
Bloomberg, Reuters, Refinitiv, Zacks, or IB users: Access Here.
Our Market Crash Leading Indicator is Evitar Corte.
Evitar Corte warned of market crash risk four times since 2000.
It identified the Internet Debacle before it happened.
It identified the Credit Crisis before it happened.
It identified the Corona Crash too.
See what Evitar Corte is Saying Now.
Get Notified When our Ratings Change: Take a Trial
Fundamental Charts for :