 pool ads
Yahoo! Inc. (NASDAQ:YHOO) Has Had Solid EPS Growth
They seem to be getting it done at Yahoo, but the turnaround is thus far happening without much growth in revenue. The growth numbers are solid though, so no one can argue with that yet, but unless revenues start to correlate more with EPS growth the music could start to wind down. For now, everyone seems to have a chair, but pay attention to the valuation.
Yahoo! Inc. (NASDAQ:YHOO) is scheduled to report earnings of 38¢ per share after the market closes on Tuesday. If the company matches estimates it will be a significant improvement vs. the same quarter of the previous year. The earnings growth trends at Yahoo have been solid on a year over year basis, but there have been recent hiccups in a quarterly growth chart we have provided.
However, given the year over year growth rates that Yahoo has been providing, the quarterly growth concerns seem to be overlooked. In the two charts below we show the trailing 12 month results for Yahoo on a quarter by quarter basis, which means that we compare the trailing 12 months that exist this quarter to the trailing 12 months that existed last quarter to determine quarterly growth rates. In the second chart we use the same trailing 12 month data but compare this quarter to the same quarter of the previous year to determine yearover year growth.
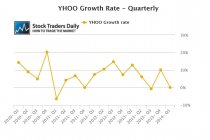
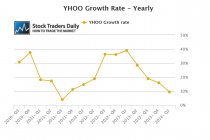
These charts tell us that quarterly growth has stalled slightly but yearly growth rates have been excellent. Although lower than they have been recently, Yahoo has year over year earnings growth in excess of 10%. That is why the stock trades at 29.5 times earnings.
Reasonably, the multiple is a little rich given the current growth rate, but if Yahoo matches estimates the growth rate should improve and the stock may not look as rich as it does today.
For traders, our real time trading report for YHOO suggests that the stock is in the middle of a longer term trading channel and there are no catalysts to buy or sell at this time, but the stock did most recently test longer term resistance and by rule we should expect the stock to fall to test longer term support. Therefore, although there are no immediate trading catalysts for the stock, there does appear to be a downside bias until at least support levels are tested again.
Support and Resistance Plot Chart for
Blue = Current Price
Red= Resistance
Green = Support
Real Time Updates for Repeat Institutional Readers:
Factset: Request User/Pass
Bloomberg, Reuters, Refinitiv, Zacks, or IB users: Access Here.
Our Market Crash Leading Indicator is Evitar Corte.
Evitar Corte warned of market crash risk four times since 2000.
It identified the Internet Debacle before it happened.
It identified the Credit Crisis before it happened.
It identified the Corona Crash too.
See what Evitar Corte is Saying Now.
Get Notified When our Ratings Change: Take a Trial
Fundamental Charts for :