Predictive AI
Adds Alpha, Reduces Beta, Controls Risk
For eBay Inc (NASDAQ:EBAY) Investors, Price Matters
eBay Inc (NASDAQ:EBAY) has hit some rocky roads recently, but should investors really be concerned? The revenue and EPS trends for EBAY have been solid, and although the recent lower Q/Q of the EPS and revenue numbers concern investors who are not familiar with the company, we're used to seeing lower first quarter numbers than what we saw during the fourth quarter of the prior year.
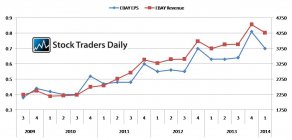
Overall, the EPS and revenue trends have been solid, but there is one important observation that needs to be made. Slowly, EPS trends are starting to lag behind revenue trends, suggesting that the company is experiencing difficulty bringing earnings to the bottom line. This affects shareholder value and shareholder perception, and it doesn't help when negative news hits the tape.
Specifically, recent negative news has included the departure of a key executive, penalties imposed by search engines, and in my observation, technical breakdowns as well. These are all concerning factors, downgrades of the stock have also occurred, but thus far there are no reasons to suggest that EBAY will not be able to continue on its path as illustrated in the chart below.
After extraordinary items are excluded, the PE multiple for EBAY is about 17 times earnings. Given that EPS growth has been exceeding double digits in recent years, this is not an obtuse multiple, but the stock is breaking down and for those investors who adhere to the notion that price is all that matters when it comes to making money in the stock market, the focus shifts from what the fundamentals might suggest to what the stock is actually telling us.
Quite often, stock prices will reflect risk in the company before the fundamentals actually begin to deteriorate on paper, and that could be true in this case as well.
According to our real time trading report for EBAY, the stock price has begun to break the longer term support level that we have identified and that presents serious risks to investors. When longer term support levels break technical red flags surface, sell signals are triggered, and short signals are triggered. This will be true so long as the stock remains under longer term support, which has now been converted into a resistance level.
Everything considered, the company is not deteriorating, but the stock certainly is, and for those people who understand that price is all that matters to making money in the stock market, they should respect the price action we are witness to.
⚠Triggers may have already come
Support and Resistance Plot Chart for
Blue = Current Price
Red= Resistance
Green = Support
Real Time Updates for Repeat Institutional Readers:
Factset: Request User/Pass
Bloomberg, Reuters, Refinitiv, Zacks, or IB users: Access Here.
Our Market Crash Leading Indicator is Evitar Corte.
Evitar Corte warned of market crash risk four times since 2000.
It identified the Internet Debacle before it happened.
It identified the Credit Crisis before it happened.
It identified the Corona Crash too.
See what Evitar Corte is Saying Now.
Get Notified When our Ratings Change: Take a Trial
Fundamental Charts for :