 pool ads
Can Twitter Inc’s (NYSE: TWTR) Management Resolve Its Current Challenges?
Twitter Inc (NYSE: TWTR) stock has done extremely well this year given that it is up about 50% so far this year. The social media company has outperformed the S&P 500 by a huge margin given that it has gained over 100% in the past 12 months as compared to the S&P’s 28% gain over a similar period.
The social media company’s performance is directly related to strategic moves made by the company’s management under the leadership of CEO and founder Jack Dorsey. However, despite the stock’s impressive performance, the company faces significant headwinds in the form of stagnating revenues as well as a user base that has been stagnant for several years.
Review Our Twitter Trading Plans Here.
Our combined analysis of the company indicates that earnings per share almost doubled in Q4 2017 following an increase in the company’s revenues during the same period. The fourth quarter spike in earnings and revenues built on the modest increases in revenues recorded in Q3, but there is no guarantee that the social media company shall replicate the positive performance in upcoming quarters.
One of the company’s main problems regards its monthly average users’ figure, which has stagnated around 328 million, and has recorded low single-digit growth in the past few years. The low MAUs have not improved despite the fact that the US president Donald Trump has popularized the micro-blogging platform through his regular tweets, which have been the hall mark of his administration.
Further analysis indicates that the social media company’s quarterly growth rate was on a downtrend since Q2 2016, but recovered in Q4 2017 to register single-digit growth. The company’s annual growth rate has also been on a similar trajectory having entered negative territory in Q1 2017 and is yet to record positive growth, but this is expected to change by next year.
We believe that the company’s management has what it takes to turnaround the company’s fortunes through launching innovative products such as its Moments products and through better content curation in order to attract more users and advertisers to its platform.
Based on the technical data and associated charts at the time this article was written, Stock Traders Daily has provided detailed trading plans, with integrated risk controls, to its clients. These plans will change in real time as prices move. To receive an update or to review the detailed trading plans associated with this data please review our Real Time Trading Report for TWTR.
Technical Summary
| Term → | Near | Mid | Long |
|---|---|---|---|
| Rating | Neutral | Weak | Strong |
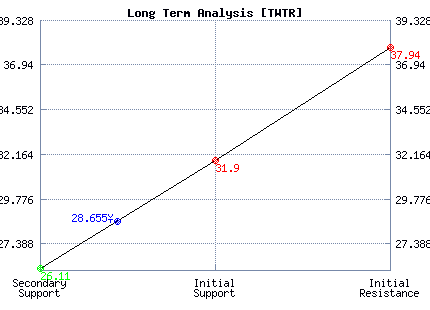
| P1 | 26.90 | 26.90 | 26.11 |
| P2 | 28.23 | 34.22 | 31.90 |
| P3 | 29.26 | 41.63 | 37.94 |
Support and Resistance Plot Chart for TWTR
Long Term Trading Plans for TWTR
April 6, 2018, 8:46 am ET
The technical Summary and associated Trading Plans for TWTR listed below will help you make important timing decisions for your trades. This data is based on our proprietary analysis for TWTR. In addition we offer Market Timing Models and Stock Filters in the links above which may increase the proficiency of the decisions you make.
TWTR - (Long) Support Plan
Buy over 26.11 target 31.90 stop loss @ 25.85.
The technical summary data tells us to buy TWTR near 26.11 with an upside target of 31.90. This data also tells us to set a stop loss @ 25.85 to protect against excessive loss in case the stock begins to move against the trade. 26.11 is the first level of support below 28.655 , and by rule, any test of support is a buy signal. In this case, support 26.11 would be being tested, so a buy signal would exist.
TWTR - (Short) Resistance Plan
Short under 31.90 target 26.11 stop loss @ 32.16.
The technical summary data is suggesting a short of TWTR as it gets near 31.90 with a downside target of 26.11. We should have a stop loss in place at 32.16 though. 31.90 is the first level of resistance above 28.655, and by rule, any test of resistance is a short signal. In this case, if resistance 31.90 is being tested, so a short signal would exist.


Blue = Current Price
Red= Resistance
Green = Support
Real Time Updates for Repeat Institutional Readers:
Factset: Request User/Pass
Bloomberg, Reuters, Refinitiv, Zacks, or IB users: Access Here.
Our Market Crash Leading Indicator is Evitar Corte.
Evitar Corte warned of market crash risk four times since 2000.
It identified the Internet Debacle before it happened.
It identified the Credit Crisis before it happened.
It identified the Corona Crash too.
See what Evitar Corte is Saying Now.
Get Notified When our Ratings Change: Take a Trial