Deere & Company (NYSE: DE) Remains A Solid Dividend Paying Stock
Given that the company is currently at its mid-cycle stage and its stock price has surged since late 2016 having recovered from a nine-year consolidation phase, the company might appear quite expensive to new investors.
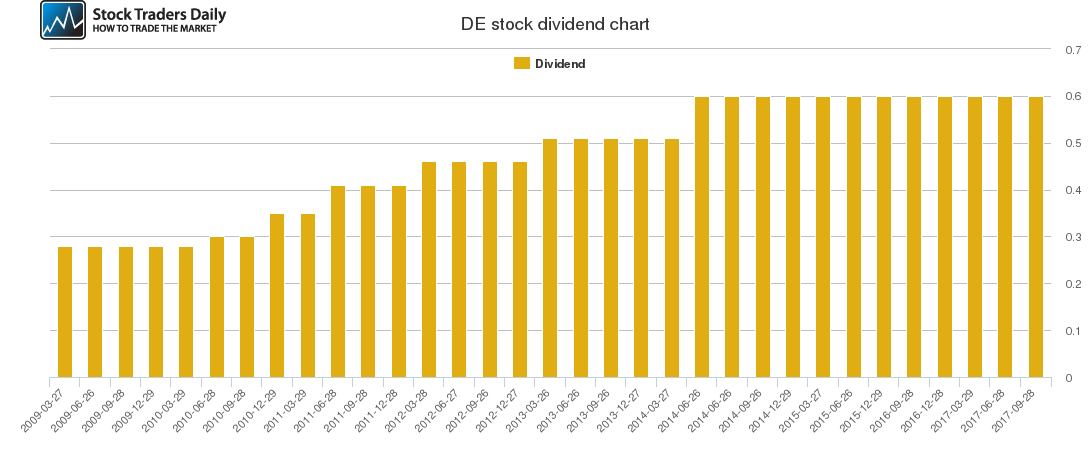
However, the company has consistently paid a stable dividend even during the 2001 recession and the Great Recession of 2008. The company’s stability over periods of high volatility and depressed economic conditions lead us to the conclusion that indeed Deere & Co. is a stable dividend growth stock.
Our combined analysis indicates that Deere is currently trading above a crucial long-term support level, which has a direct impact on the real-time trading plans provided to our clients. The company’s stock price has recently rallied higher, but despite the rally, the company still has a dividend payout of 1.42%, which is impressive given its slim operating margins.
The company’s revenues for fiscal Q1 came in much lower than revenues for the last two quarters, which was expected given that Q1 is typically the company’s weakest quarter. Although the company’s Q1 revenues missed Wall Street expectations, the revenues still recorded a 27% year-over-year increase.
The company has consistently performed well despite being in an old-economy industry as its main business is farm machinery. The fact that agriculture contributes only a tiny percentage of US GDP, which is replicated in other developed countries, has not stopped the company from reporting positive performance over the years.
The company’s future growth prospects appear quite encouraging given that it recently acquired the Wirtgen Group to expand its footprint in the road construction equipment industry. The company’s annual growth rate is expected to expand this year, while quarterly growth is also expected to increase.
Based on the technical data and associated charts at the time this article was written, Stock Traders Daily has provided detailed trading plans, with integrated risk controls, to its clients. These plans will change in real time as prices move. To receive an update or to review the detailed trading plans associated with this data please review our Real Time Trading Report for Deere & Co.
Technical Summary
| Term → | Near | Mid | Long |
|---|---|---|---|
| Rating | Weak | Neutral | Neutral |
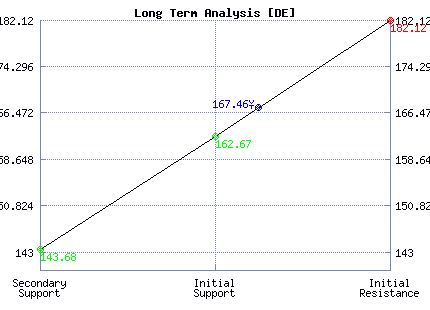
| P1 | 162.12 | 155.26 | 143.68 |
| P2 | 164.64 | 168.45 | 162.67 |
| P3 | 169.35 | 180.30 | 182.12 |
Support and Resistance Plot Chart for DE
Long Term Trading Plans for DE
February 27, 2018, 10:22 am ET
The technical Summary and associated Trading Plans for DE listed below will help you make important timing decisions for your trades. This data is based on our proprietary analysis for DE. In addition we offer Market Timing Models and Stock Filters in the links above which may increase the proficiency of the decisions you make.
DE - (Long) Support Plan
Buy over 162.67 target 182.12 stop loss @ 162.41.
The technical summary data tells us to buy DE near 162.67 with an upside target of 182.12. This data also tells us to set a stop loss @ 162.41 to protect against excessive loss in case the stock begins to move against the trade. 162.67 is the first level of support below 167.46 , and by rule, any test of support is a buy signal. In this case, support 162.67 is being tested, a buy signal would exist.
DE - (Short) Resistance Plan
Short under 182.12 target 162.67 stop loss @ 182.38
The technical summary data is suggesting a short of DE as it gets near 182.12 with a downside target of 162.67. We should have a stop loss in place at 182.38 though. 182.12 is the first level of resistance above 167.46, and by rule, any test of resistance is a short signal. In this case, if resistance 182.12 is being tested, a short signal would exist.


Blue = Current Price
Red = Resistance
Green = Support
Real Time Updates for Repeat Institutional Readers:
Factset: Request User/Pass
Bloomberg, Reuters, Refinitiv, Zacks, or IB users: Access Here.
Our Market Crash Leading Indicator is Evitar Corte.
Evitar Corte warned of market crash risk four times since 2000.
It identified the Internet Debacle before it happened.
It identified the Credit Crisis before it happened.
It identified the Corona Crash too.
See what Evitar Corte is Saying Now.
Get Notified When our Ratings Change: Take a Trial
Fundamental Charts for DE: