 pool ads
Ford Motor Company (NYSE: F) Is Underperforming Other US Automakers
Ford Motor Company (NYSE: F) reported its fourth quarter results towards the end of January where its revenues beat expectations, but its profits were lower than expected. The disappointing results led the company’s stock price to drop slightly as investors reacted to the earnings report.
The company slightly redeemed itself by releasing its January sales report, which indicated that the F-Series truck had generated its best sales figures since January 2004. However, despite this being true, other types of vehicles sold by Ford witnessed significant drops in sales, according to data from the Bureau of Economic Analysis.
Our proprietary analysis indicates that the company’s revenue was on a downtrend as from Q4 2015, but recovered in the latest quarter as the company reported total revenues of $41.3 billion, which beat analysts’ expectations. However, Ford’s bottom line missed by coming in at $1.74 billion, which was lower than the previous year’s $1.86 billion pre-tax profit. The company also reported that its margins declined by about 2% in the latest quarter.
The January auto sales report indicates that Ford is losing market share to its rivals led by General Motors Company (NYSE: GM), whose vehicles recorded significant sales growth in January. Overall, Ford reported a 6.6% decline in vehicles sold, while individual brands reported much higher percentage declines as evidenced by the Lincoln brand, which reported a 27% decline in units sold.
The massive decline in sales witnessed by Ford was largely driven by the weak demand for Lincoln branded cars. Examples include the Lincoln MKZ, which saw a 43.7% decline in sales, followed closely by the MKX, which reported a 38.1% decline, and the Continental, which posted a 30.2% decline. These declines are significant given that GM reported a 14% increase in Silverado sales, while the Colorado model reported 25% growth.
Based on the technical data and associated charts at the time this article was written, Stock Traders Daily has provided detailed trading plans, with integrated risk controls, to its clients. These plans will change in real time as prices move. To receive an update or to review the detailed trading plans associated with this data please review our Real Time Trading Report for Ford.
Technical Summary
| Term → | Near | Mid | Long |
|---|---|---|---|
| Rating | Neutral | Weak | Neutral |
| P1 | 10.80 | 9.60 | 10.77 |
| P2 | 10.95 | 12.19 | |
| P3 | 0 | 12.25 | 13.57 |
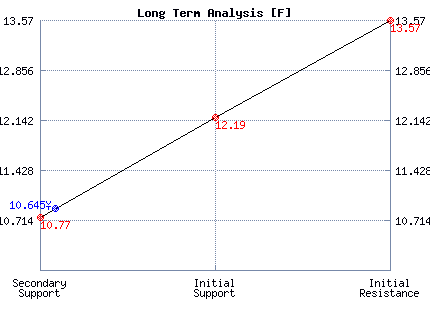
Support and Resistance Plot Chart for F
Long Term Trading Plans for F
February 22, 2018, 1:42 pm ET
The technical Summary and associated Trading Plans for F listed below will help you make important timing decisions for your trades. This data is based on our proprietary analysis for F. In addition we offer Market Timing Models and Stock Filters in the links above which may increase the proficiency of the decisions you make.
F - (Long) Support Plan
There is no current Support Plan to trigger a buy of this stock at this time. This usually means that there are no clear support levels at this time, so buying the stock as it falls could be considered catching a falling knife. Buy signals only exist if resistance breask higher.
This often is a signal that the stock you are watching is weak. Waiting for a turn higher may be more intelligent than trying to catch a falling knife. In any case, new support levels are usually revised to the database at the beginning of the next trading session.
F - (Short) Resistance Plan
Short under 10.77, target n/a, stop loss @ 11.03.
The technical summary data is suggesting a short of F as it gets near 10.77, but the downside target is not available from the current data. This tells us to hold that position if it is triggered until a new downside target has been established (updates occur at the beginning of every trading session) or until the position has been stopped. The summary data tells us to have a stop loss in place at 11.03. 10.77 is the first level of resistance above 10.645, and by rule, any test of resistance is a short signal. In this case, if resistance 10.77 is being tested, so a short signal would exist.


Blue = Current Price
Red= Resistance
Green = Support
Real Time Updates for Repeat Institutional Readers:
Factset: Request User/Pass
Bloomberg, Reuters, Refinitiv, Zacks, or IB users: Access Here.
Our Market Crash Leading Indicator is Evitar Corte.
Evitar Corte warned of market crash risk four times since 2000.
It identified the Internet Debacle before it happened.
It identified the Credit Crisis before it happened.
It identified the Corona Crash too.
See what Evitar Corte is Saying Now.
Get Notified When our Ratings Change: Take a Trial