 pool ads
Is Allergan plc (NYSE: AGN) About To Reverse Is Current Downtrend?
Allergan plc (NYSE: AGN) is a pharmaceutical company that boasts of a strong balance sheet as well as a reducing debt burden, yet its stock has been declining on the stock market. The question on most value investors’ minds is whether the company is ready to reverse its current downtrend or in other words, has it bottomed yet?
There are many reasons that suggest the current sell-off in Allergan stock is unwarranted given the fact that the company grew its revenues by 9% in 2017, while at the same time reducing its debt by $2.9 billion. The company also completed a $15 billion share buyback program, which complemented the revenue growth achieved by the company.
Review Our Allergan plc Trading Plans Here.
Our combined analysis of the company indicates that its quarterly earnings are likely to drop in the upcoming quarter despite the growth witnessed in the previous quarter. The same trend is expected to be replicated in its revenues, which also recorded growth in the previous quarter, but might drop in the next quarter.
The company’s quarterly growth rate is expected to dip in the next quarter and the same also applies to its annual growth, which is likely to decline this year. However, the company’s future prospects appear quite promising given its 2017 performance and its positive future outlook derived from its diversified product portfolio.
According to the company’s full-year report, it launched 12 new products into the market and managed its operating expenses, which was crucial to attaining its current healthy margins. The company also expanded its beauty and cosmetics business by acquiring and growing the CoolSculpting and Regenerative Medicine businesses.
The company is also repositioning itself a manufacturer of many other products apart from its Botox products, of which it is well known. The company also grew its market share in the irritable bowel syndrome market through offering products such as Linzess and Viberzi, which have significant growth potential. Other growth opportunities exist in the eye care segment and in the manufacture of generic drugs.
Based on the technical data and associated charts at the time this article was written, Stock Traders Daily has provided detailed trading plans, with integrated risk controls, to its clients. These plans will change in real time as prices move. To receive an update or to review the detailed trading plans associated with this data please review our Real Time Trading Report for AGN.
Technical Summary
| Term → | Near | Mid | Long |
|---|---|---|---|
| Rating | Strong | Neutral | Weak |
| P1 | 162.97 | 138.23 | 119.09 |
| P2 | 167.13 | 159.28 | 146.05 |
| P3 | 171.43 | 180.27 | 172.78 |
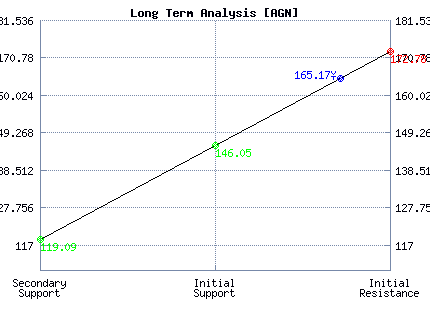
Support and Resistance Plot Chart for AGN
Long Term Trading Plans for AGN
March 20, 2018, 12:54 pm ET
The technical Summary and associated Trading Plans for AGN listed below will help you make important timing decisions for your trades. This data is based on our proprietary analysis for AGN. In addition we offer Market Timing Models and Stock Filters in the links above which may increase the proficiency of the decisions you make.
AGN - (Long) Support Plan
Buy over 146.05 target 172.78 stop loss @ 145.79.
The technical summary data tells us to buy AGN near 146.05 with an upside target of 172.78. This data also tells us to set a stop loss @ 145.79 to protect against excessive loss in case the stock begins to move against the trade. 146.05 is the first level of support below 165.17 , and by rule, any test of support is a buy signal. In this case, support 146.05 is being tested, a buy signal would exist.
AGN - (Short) Resistance Plan
Short under 172.78 target 146.05 stop loss @ 173.04
The technical summary data is suggesting a short of AGN as it gets near 172.78 with a downside target of 146.05. We should have a stop loss in place at 173.04 though. 172.78 is the first level of resistance above 165.17, and by rule, any test of resistance is a short signal. In this case, if resistance 172.78 is being tested, a short signal would exist.


Blue = Current Price
Red= Resistance
Green = Support
Real Time Updates for Repeat Institutional Readers:
Factset: Request User/Pass
Bloomberg, Reuters, Refinitiv, Zacks, or IB users: Access Here.
Our Market Crash Leading Indicator is Evitar Corte.
Evitar Corte warned of market crash risk four times since 2000.
It identified the Internet Debacle before it happened.
It identified the Credit Crisis before it happened.
It identified the Corona Crash too.
See what Evitar Corte is Saying Now.
Get Notified When our Ratings Change: Take a Trial