 pool ads
JetBlue Airways Corporation (NASDAQ: JBLU) Has Future Growth Opportunities
JetBlue Airways Corporation (NASDAQ: JBLU) recently released its traffic report for January 2018, which revealed that the airline experienced a decline in revenue passenger miles (RPMs). The airline also reported that its available seat miles (ASMs) had expanded by 0.1%, which is quite low as compared to last year’s figures and the airline’s historic average.
Despite the decline noted above, JetBlue’s RPMs are much higher than those of its main competitors Southwest Airlines Co (NYSE: LUV), Delta Air Lines, Inc. (NYSE: DAL) and United Continental Holdings Inc (NYSE: UAL); this is despite the fact that JetBlue is much smaller than its three rivals.
Review Our JetBlue Trading Plans Here.
Our analysis of the airline indicates that it is expected to book an expansion in its quarterly revenues in Q1 2018 despite the fact that it reported declining revenues in Q3 and Q4 of 2017. The company’s overall revenues last registered growth in Q2 2017 after which the airline booked lower revenues over the next two quarters.
According to our fundamental analysis, the airline has significant growth opportunities in cities such as Boston where it already has a significant presence. The airline is currently the leading carrier in Boston as it boasts of over 150 daily departures from the city, while at the same time controlling 24 gates at the city’s Logan International Airport.
JetBlue also has an opportunity to expand its fleet given that a significant percentage of its current fleet of Embraer E190 jets are aging. The company could choose to retire some of its aging fleet much earlier and replace them with the more advanced Embraer E190-E2 jets.
The company has been steadily growing its annual growth rate in the past few years and this metric is expected to expand throughout this year, but it is likely to contract over the next year. The airline is also expected to benefit significantly from the recently enacted tax reform bill, which will boost its free cash flows due to the lower tax rate.
Based on the technical data and associated charts at the time this article was written, Stock Traders Daily has provided detailed trading plans, with integrated risk controls, to its clients. These plans will change in real time as prices move. To receive an update or to review the detailed trading plans associated with this data please review our Real Time Trading Report for JBLU.
Technical Summary
| Term → | Near | Mid | Long |
|---|---|---|---|
| Rating | Strong | Neutral | Neutral |
| P1 | 20.90 | 18.80 | 17.25 |
| P2 | 21.30 | 20.60 | 20.36 |
| P3 | 22.05 | 22.30 | 23.49 |
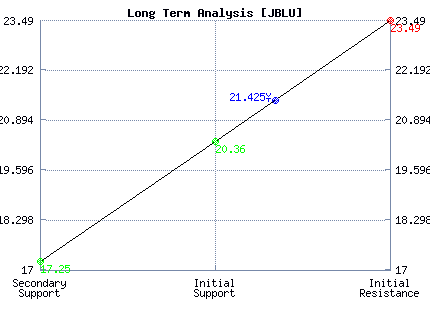
Support and Resistance Plot Chart for JBLU
Long Term Trading Plans for JBLU
March 1, 2018, 12:51 pm ET
The technical Summary and associated Trading Plans for JBLU listed below will help you make important timing decisions for your trades. This data is based on our proprietary analysis for JBLU. In addition we offer Market Timing Models and Stock Filters in the links above which may increase the proficiency of the decisions you make.
JBLU - (Long) Support Plan
Buy over 20.36 target 23.49 stop loss @ 20.1.
The technical summary data tells us to buy JBLU near 20.36 with an upside target of 23.49. This data also tells us to set a stop loss @ 20.1 to protect against excessive loss in case the stock begins to move against the trade. 20.36 is the first level of support below 21.425 , and by rule, any test of support is a buy signal. In this case, support 20.36 is being tested, a buy signal would exist.
JBLU - (Short) Resistance Plan
Short under 23.49 target 20.36 stop loss @ 23.75
The technical summary data is suggesting a short of JBLU as it gets near 23.49 with a downside target of 20.36. We should have a stop loss in place at 23.75 though. 23.49 is the first level of resistance above 21.425, and by rule, any test of resistance is a short signal. In this case, if resistance 23.49 is being tested, a short signal would exist.


Blue = Current Price
Red= Resistance
Green = Support
Real Time Updates for Repeat Institutional Readers:
Factset: Request User/Pass
Bloomberg, Reuters, Refinitiv, Zacks, or IB users: Access Here.
Our Market Crash Leading Indicator is Evitar Corte.
Evitar Corte warned of market crash risk four times since 2000.
It identified the Internet Debacle before it happened.
It identified the Credit Crisis before it happened.
It identified the Corona Crash too.
See what Evitar Corte is Saying Now.
Get Notified When our Ratings Change: Take a Trial