 pool ads
KB Home (NYSE: KBH) Is Facing Major Headwinds as Mortgage Rates Rise
KB Home (NYSE: KBH) has had a good run up in price over the last two years starting in 2016 as its stock price has rallied by about 137% over the same period. The company has outperformed most of its peers including Lennar Corporation (NYSE: LEN), D. R. Horton Inc (NYSE: DHI) and Toll Brothers Inc (NYSE: TOL)
According to the company’s investor brief, its main markets are millennial first time buyers and home owners who are making their first move up. A report by Zillow released last year revealed that millennials are the biggest percentage of home buyers, which implies that KB Home’s focus on this demographic is well advised and could pay off over the long-term.
Review Our KB Home Trading Plans Here.
However, rising mortgage rates could put a damper on home purchases by millennials who are already feeling burdened by the previous rates, which were much lower. According to the Zillow report a significant percentage of millennial home buyers are struggling to pay the standard 20% down payment and many are paying the bare minimum to purchase their homes.
Our combined analysis of the company indicates that its earnings are expected to dip in the upcoming quarter as the higher mortgage rates continue to affect potential home buyers. The company’s rising revenues are also likely to contract in the next quarter.
The company’s quarterly growth rate, which was higher than 50% in the last quarter is also expected to dip in the current quarter. The company’s annual growth rate, which was at a cumulative 100% in the last quarter is also expected to record a slight gain this year, but a huge drop off is expected next year.
Other factors that investors should consider in regards to KB Home is that the company is expensively valued in relation to its peers. This would not be a major concern if the company’s gross margins had expanded in tandem with its stock price, but this was not the case as its profits have barely improved despite the rising home prices.
Based on the technical data and associated charts at the time this article was written, Stock Traders Daily has provided detailed trading plans, with integrated risk controls, to its clients. These plans will change in real time as prices move. To receive an update or to review the detailed trading plans associated with this data please review our Real Time Trading Report for KBH.
Technical Summary
| Term → | Near | Mid | Long |
|---|---|---|---|
| Rating | Weak | Weak | Neutral |
| P1 | 27.66 | 24.91 | 27.66 |
| P2 | 28.59 | 28.69 | 33.10 |
| P3 | 29.48 | 32.82 | 38.71 |
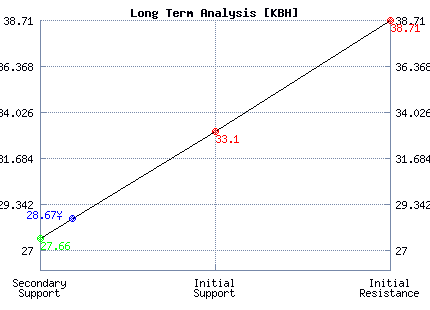
Support and Resistance Plot Chart for KBH
Long Term Trading Plans for KBH
March 20, 2018, 12:54 pm ET
The technical Summary and associated Trading Plans for KBH listed below will help you make important timing decisions for your trades. This data is based on our proprietary analysis for KBH. In addition we offer Market Timing Models and Stock Filters in the links above which may increase the proficiency of the decisions you make.
KBH - (Long) Support Plan
Buy over 27.66 target 33.10 stop loss @ 27.4.
The technical summary data tells us to buy KBH near 27.66 with an upside target of 33.10. This data also tells us to set a stop loss @ 27.4 to protect against excessive loss in case the stock begins to move against the trade. 27.66 is the first level of support below 28.67 , and by rule, any test of support is a buy signal. In this case, support 27.66 would be being tested, so a buy signal would exist.
KBH - (Short) Resistance Plan
Short under 33.10 target 27.66 stop loss @ 33.36.
The technical summary data is suggesting a short of KBH as it gets near 33.10 with a downside target of 27.66. We should have a stop loss in place at 33.36 though. 33.10 is the first level of resistance above 28.67, and by rule, any test of resistance is a short signal. In this case, if resistance 33.10 is being tested, so a short signal would exist.


Blue = Current Price
Red= Resistance
Green = Support
Real Time Updates for Repeat Institutional Readers:
Factset: Request User/Pass
Bloomberg, Reuters, Refinitiv, Zacks, or IB users: Access Here.
Our Market Crash Leading Indicator is Evitar Corte.
Evitar Corte warned of market crash risk four times since 2000.
It identified the Internet Debacle before it happened.
It identified the Credit Crisis before it happened.
It identified the Corona Crash too.
See what Evitar Corte is Saying Now.
Get Notified When our Ratings Change: Take a Trial