 pool ads
MGM Resorts International (NYSE: MGM) Opens New Resort in Cotai Strip Macau
MGM Resorts International (NYSE: MGM) recently opened its new resort along the Cotai Strip in Macau after postponing the opening severally since 2016. The company is following in the footsteps of its two main competitors Las Vegas Sands Corp. (NYSE: LVS) and Wynn Resorts, Limited (NASDAQ: WYNN), which already have establishments on the family-friendly Cotai Strip.
The opening of the MGM Cotai was well timed to capitalize on the Chinese New Year holiday, which usually generates a lot of demand for rooms in the gaming island of Macau. This year, many of the gaming resorts that operate in Macau have reported full capacity bookings as Chinese tourists flock Macau, which is the only region where Chinese citizens can legally gamble.
Our technical analysis of MGM stock indicates that the company’s earnings per share are likely to remain flat in the upcoming quarterly report. This is despite the fact that the company’s revenues have been rising since Q1 2016 and revenues are expected to beat expectations in the upcoming quarter.
Resorts in Macau reported significant growth in January revenues by about 36% due to demand generated by high-spending gamblers as well as ordinary punters. However, the future of gambling establishments along the special-administrative region lies in the balance given that MGM’s gaming license is set to expire in 2020, while the Sands China and Wynn Macau gaming licenses are up for renewal in 2022.
Given the recent jump in revenues for gaming operators in Macau, we expect MGM’s quarterly growth to improve slightly, while yearly growth is expected to remain relatively flat as outlined in the charts below. The new resort is expected to increase MGM’s non-gaming revenues even as Chinese authorities have raised concerns about the high gambling and gaming revenues in Macau.
Based on the technical data and associated charts at the time this article was written, Stock Traders Daily has provided detailed trading plans, with integrated risk controls, to its clients. These plans will change in real time as prices move. To receive an update or to review the detailed trading plans associated with this data please review our Real Time Trading Report for MGM.
Technical Summary
| Term → | Near | Mid | Long |
|---|---|---|---|
| Rating | Neutral | Neutral | Neutral |
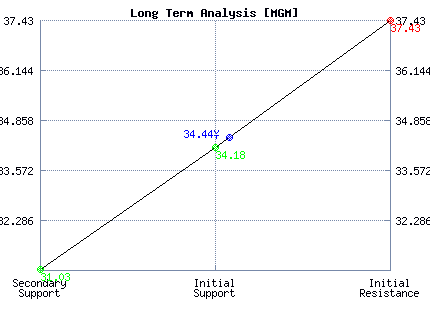
| P1 | 32.37 | 32.58 | 31.03 |
| P2 | 33.70 | 35.59 | 34.18 |
| P3 | 34.42 | 38.58 | 37.43 |
Support and Resistance Plot Chart for MGM
Long Term Trading Plans for MGM
February 15, 2018, 8:05 am ET
The technical Summary and associated Trading Plans for MGM listed below will help you make important timing decisions for your trades. This data is based on our proprietary analysis for MGM. In addition we offer Market Timing Models and Stock Filters in the links above which may increase the proficiency of the decisions you make.
MGM - (Long) Support Plan
Buy over 34.18 target 37.43 stop loss @ 33.92.
The technical summary data tells us to buy MGM near 34.18 with an upside target of 37.43. This data also tells us to set a stop loss @ 33.92 to protect against excessive loss in case the stock begins to move against the trade. 34.18 is the first level of support below 34.44 , and by rule, any test of support is a buy signal. In this case, support 34.18 is being tested, a buy signal would exist.
MGM - (Short) Resistance Plan
Short under 37.43 target 34.18 stop loss @ 37.69
The technical summary data is suggesting a short of MGM as it gets near 37.43 with a downside target of 34.18. We should have a stop loss in place at 37.69 though. 37.43 is the first level of resistance above 34.44, and by rule, any test of resistance is a short signal. In this case, if resistance 37.43 is being tested, a short signal would exist.


Blue = Current Price
Red= Resistance
Green = Support
Real Time Updates for Repeat Institutional Readers:
Factset: Request User/Pass
Bloomberg, Reuters, Refinitiv, Zacks, or IB users: Access Here.
Our Market Crash Leading Indicator is Evitar Corte.
Evitar Corte warned of market crash risk four times since 2000.
It identified the Internet Debacle before it happened.
It identified the Credit Crisis before it happened.
It identified the Corona Crash too.
See what Evitar Corte is Saying Now.
Get Notified When our Ratings Change: Take a Trial