Should Netflix, Inc. (NASDAQ: NFLX) Shareholders Worry About Its Cash Flow?
An in-depth analysis of Netflix, Inc. (NASDAQ: NFLX) cash flows reveals that the company recorded negative $2 billion in net cash flows over the past twelve months. The company is currently trading at 10x its revenues, which implies an expensive valuation.
To put Netflix’s current performance in perspective, it is vital to also analyze its close competitor the Walt Disney Co (NYSE: DIS), which trades at a P/E ratio of 14.64 as compared to Netflix’s 199.46 P/E ratio. Netflix recently reported a net profit margin of 5.65%, which is much lower than Disney’s 28.81% net profit margin.
According to the chart below, Netflix’s EPS is expected to expand to approximately $0.53 in the next quarter. This is good news for the company’s shareholders as it indicates that the company is likely generate more free cash flow. However, given the massive investments the company is putting into the production of original content, it is highly likely that not much of the extra earnings shall trickle down to shareholders.
The revenue chart below also indicates that Netflix has been growing its revenues steadily for the past 8 years, which bodes well for shareholders. However, the company has recently lost many of its popular shows, especially since Disney is set to withdraw its popular franchises such as the Star Wars and Marvel franchises from Netflix as it launches its own streaming service.
The company’s future growth prospects are not very promising given that quarterly growth is expected to dip in the next quarter, while annual growth is expected to remain flat, according to the TTM chart below. Netflix is facing major headwinds, which include increasing competition from cheaper streaming services and the high costs of producing original content.
At the time of writing this article, Stock Traders Daily was providing trading plans for NFLX based on the technical data displayed in the table below. These plans include buys and sell signals, but they also offer risk controls, which include profit stops and price targets for both long term ad short term trading objectives.
Access our NFLX trading plans here.
Technical Summary
| Term → | Near | Mid | Long |
|---|---|---|---|
| Rating | Weak | Strong | Neutral |
| P1 | 237.94 | 216.15 | 193.37 |
| P2 | 254.23 | 254.83 | 227.42 |
| P3 | 268.77 | 296.02 | 264.39 |
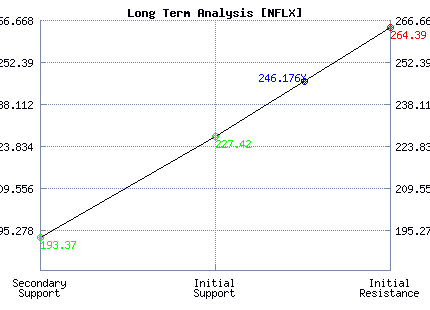
Support and Resistance Plot Chart for NFLX
Long Term Trading Plans for NFLX
February 12, 2018, 9:25 am ET
The technical Summary and associated Trading Plans for NFLX listed below will help you make important timing decisions for your trades. This data is based on our proprietary analysis for NFLX. In addition we offer Market Timing Models and Stock Filters in the links above which may increase the proficiency of the decisions you make.
NFLX - (Long) Support Plan
Buy over 227.42 target 264.39 stop loss @ 227.16.
The technical summary data tells us to buy NFLX near 227.42 with an upside target of 264.39. This data also tells us to set a stop loss @ 227.16 to protect against excessive loss in case the stock begins to move against the trade. 227.42 is the first level of support below 246.176 , and by rule, any test of support is a buy signal. In this case, support 227.42 is being tested, a buy signal would exist.
NFLX - (Short) Resistance Plan
Short under 264.39 target 227.42 stop loss @ 264.65
The technical summary data is suggesting a short of NFLX as it gets near 264.39 with a downside target of 227.42. We should have a stop loss in place at 264.65 though. 264.39 is the first level of resistance above 246.176, and by rule, any test of resistance is a short signal. In this case, if resistance 264.39 is being tested, a short signal would exist.


Blue = Current Price
Red= Resistance
Green = Support
Real Time Updates for Repeat Institutional Readers:
Factset: Request User/Pass
Bloomberg, Reuters, Refinitiv, Zacks, or IB users: Access Here.
Our Market Crash Leading Indicator is Evitar Corte.
Evitar Corte warned of market crash risk four times since 2000.
It identified the Internet Debacle before it happened.
It identified the Credit Crisis before it happened.
It identified the Corona Crash too.
See what Evitar Corte is Saying Now.
Get Notified When our Ratings Change: Take a Trial
