 pool ads
Should United Technologies Corporation (NYSE: UTX) Initiate Spin-Off Procedures?
The CEO of United Technologies Corporation (NYSE: UTX) recently softened his stance towards a spin-off of the company’s different operating segments while giving a talk at the Barclays investment conference. However, although the company’s main divisions operate independent of each other, the likelihood of the company achieving operational synergies after a break-up is highly unlikely.
Other major drawbacks to a spin-off of the different business segments including Pratt & Whitney, Otis, UTX Aerospace Systems, and Rockwell Collins once the deal closes is the debt incurred by the company in order to complete the acquisition. The company currently has very high debt rating, which could be downgraded after a spin-off given that each separate division would have to meet its debt obligations independent of the other divisions.
Review Our UTX Trading Plans Here.
Our combined analysis indicates that the company’s overall earnings are set to increase in the next quarter and throughout 2018, which is outlined in the charts below plotting EPS growth. The company’s management delivered 5% organic growth in 2017, which is an impressive figure for such a diversified conglomerate given that other conglomerates such as the General Electric Company (NYSE: GE) barely recorded any growth.
Although the company’s quarterly growth has been fairly stable in recent quarters, we expect the company to record a significant increase in quarterly revenues this year. The company’s annual growth figures have been rising steadily since Q3 2017 and this is expected to accelerate this year and into the next year.
It is evident that there are no strong reasons for UTX to break-up its core business segment given that none of them are loss making or are being neglected, which means that rationale for breaking up the company does not have solid grounds. UTX is much stronger and financially stable with all its operating units as part of a well-run and profitable conglomerate.
Based on the technical data and associated charts at the time this article was written, Stock Traders Daily has provided detailed trading plans, with integrated risk controls, to its clients. These plans will change in real time as prices move. To receive an update or to review the detailed trading plans associated with this data please review our Real Time Trading Report for UTX.
Technical Summary
| Term → | Near | Mid | Long |
|---|---|---|---|
| Rating | Weak | Neutral | Neutral |
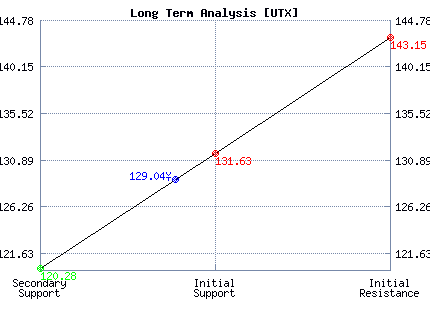
| P1 | 127.53 | 122.45 | 120.28 |
| P2 | 129.75 | 132.05 | 131.63 |
| P3 | 132.73 | 141.22 | 143.15 |
Support and Resistance Plot Chart for UTX
Long Term Trading Plans for UTX
March 19, 2018, 8:45 am ET
The technical Summary and associated Trading Plans for UTX listed below will help you make important timing decisions for your trades. This data is based on our proprietary analysis for UTX. In addition we offer Market Timing Models and Stock Filters in the links above which may increase the proficiency of the decisions you make.
UTX - (Long) Support Plan
Buy over 120.28 target 131.63 stop loss @ 120.02.
The technical summary data tells us to buy UTX near 120.28 with an upside target of 131.63. This data also tells us to set a stop loss @ 120.02 to protect against excessive loss in case the stock begins to move against the trade. 120.28 is the first level of support below 129.04 , and by rule, any test of support is a buy signal. In this case, support 120.28 would be being tested, so a buy signal would exist.
UTX - (Short) Resistance Plan
Short under 131.63 target 120.28 stop loss @ 131.89.
The technical summary data is suggesting a short of UTX as it gets near 131.63 with a downside target of 120.28. We should have a stop loss in place at 131.89 though. 131.63 is the first level of resistance above 129.04, and by rule, any test of resistance is a short signal. In this case, if resistance 131.63 is being tested, so a short signal would exist.


Blue = Current Price
Red= Resistance
Green = Support
Real Time Updates for Repeat Institutional Readers:
Factset: Request User/Pass
Bloomberg, Reuters, Refinitiv, Zacks, or IB users: Access Here.
Our Market Crash Leading Indicator is Evitar Corte.
Evitar Corte warned of market crash risk four times since 2000.
It identified the Internet Debacle before it happened.
It identified the Credit Crisis before it happened.
It identified the Corona Crash too.
See what Evitar Corte is Saying Now.
Get Notified When our Ratings Change: Take a Trial