 pool ads
When Will Skechers USA Inc (NYSE: SKX) Stabilize For Predictable Returns?
Skechers USA Inc (NYSE: SKX) is a US footwear manufacturer that was founded in 1992 and has grown to become the third-largest athletic footwear brand in the USA. However, despite the company’s impressive growth over the last two decades, investors in the company have had to endure wild swings in volatility as the company experienced periods of fast growth followed by periods of negative growth.
Our combined analysis of the company indicates that it has experienced highly volatile growth metrics in the past as evidenced by the 40% growth recorded in 2010 followed by the drastic decline to -20% growth in 2011. It is this volatility that has limited the company’s stock price from growing significantly in the past.
Review Our Skechers Trading Plans Here.
The company’s quarterly growth metric has been extremely volatile in the past with operating margins oscillating between negative and positive territory. The question on most investors’ minds is whether the company’s volatile past is actually in the past given the significant run-up in the company’s stock price over the past nine months.
The main cause of the volatility in Skechers’ revenues and margins was the management’s inability to control costs, which is what caused the many spikes and dips in revenues, during past years. However, there are significant differences between the decline that occurred in 2011 and the one that occurred in 2016-2017, both of which were followed by significant growth in the company’s revenues and margins.
Skechers’ latest growth story was largely fueled by the company’s efforts to expand into international markets and to develop products that align with changing consumer preferences towards athletic footwear. However, the pre-2011 growth spike was largely fueled by the popularity of shape-up shoes that were in the toning category where the company controlled 60% of the market, which made the growth quite unsustainable.
The company’s latest growth trajectory seems quite sustainable and although it might be too early to categorize the company as being stable, there is a high likelihood that the company might achieve some stability in the near future.
Based on the technical data and associated charts at the time this article was written, Stock Traders Daily has provided detailed trading plans, with integrated risk controls, to its clients. These plans will change in real time as prices move. To receive an update or to review the detailed trading plans associated with this data please review our Real Time Trading Report for SKX.
Technical Summary
| Term → | Near | Mid | Long |
|---|---|---|---|
| Rating | Strong | Neutral | Strong |
| P1 | 38.31 | 37.36 | 36.84 |
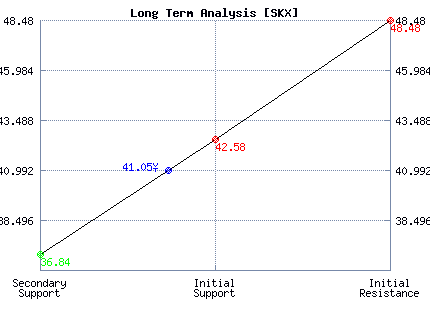
| P2 | 40.02 | 39.98 | 42.58 |
| P3 | 40.82 | 42.57 | 48.48 |
Support and Resistance Plot Chart for SKX
Long Term Trading Plans for SKX
April 6, 2018, 8:46 am ET
The technical Summary and associated Trading Plans for SKX listed below will help you make important timing decisions for your trades. This data is based on our proprietary analysis for SKX. In addition we offer Market Timing Models and Stock Filters in the links above which may increase the proficiency of the decisions you make.
SKX - (Long) Support Plan
Buy over 36.84 target 42.58 stop loss @ 36.58.
The technical summary data tells us to buy SKX near 36.84 with an upside target of 42.58. This data also tells us to set a stop loss @ 36.58 to protect against excessive loss in case the stock begins to move against the trade. 36.84 is the first level of support below 41.05 , and by rule, any test of support is a buy signal. In this case, support 36.84 would be being tested, so a buy signal would exist.
SKX - (Short) Resistance Plan
Short under 42.58 target 36.84 stop loss @ 42.84.
The technical summary data is suggesting a short of SKX as it gets near 42.58 with a downside target of 36.84. We should have a stop loss in place at 42.84 though. 42.58 is the first level of resistance above 41.05, and by rule, any test of resistance is a short signal. In this case, if resistance 42.58 is being tested, so a short signal would exist.


Blue = Current Price
Red= Resistance
Green = Support
Real Time Updates for Repeat Institutional Readers:
Factset: Request User/Pass
Bloomberg, Reuters, Refinitiv, Zacks, or IB users: Access Here.
Our Market Crash Leading Indicator is Evitar Corte.
Evitar Corte warned of market crash risk four times since 2000.
It identified the Internet Debacle before it happened.
It identified the Credit Crisis before it happened.
It identified the Corona Crash too.
See what Evitar Corte is Saying Now.
Get Notified When our Ratings Change: Take a Trial