Will Exxon Mobil Corporation (NYSE: XOM) Return To Growth Soon?
Exxon Mobil Corporation (NYSE: XOM) has registered negative revenue growth over the past few years due to an industry-wide downturn triggered by low global oil prices. However, the oil major has continued to make massive investments in projects that are likely to bear fruit in the near future such as its investments in high quality shale assets.
The oil major is set to spend about $24 billion in capital expenditures in 2018 and this sum is set to increase to $28 billion in 2019, which bodes well for the company’s future. The company also has a major advantage in that it is not only an oil company, but its revenues come from upstream and downstream operations as well as from the sale of industrial chemicals.
Review Our XOM Trading Plans Here.
Our combined analysis of the company indicates that its revenues declined slightly in Q4 2017, but are expected to increase in the current quarter. The company lagged behind some of its competitors such as Pioneer Natural Resources (NYSE: PXD) and EOG Resources Inc (NYSE: EOG) who benefitted significantly from the shale oil boom in recent years.
According to our analysis, the company’s quarterly growth rate also declined significantly in Q2 and Q3 2017 before improving slightly in Q4 2017. Further technical analysis reveals that the company’s quarterly and annual growth rates are expected to decline significantly in the near-term, but our fundamental analysis reveals a bright future for the company over the intermediate to long-term timeframe.
The changing global energy trends have put the future of oil in jeopardy with many experts predicting that demand for oil will decrease significantly in the next few years. However, Exxon Mobile is well-positioned within the energy supply chain and is already exploring ways to capitalize on the increasing demand for renewable energy sources.
Apart from exploring renewable energy investments, the company is also expanding its global footprint in the crude oil industry through numerous acquisitions of smaller oil companies and through capital investments. The oil major has increased its oil output significantly and has invested heavily in advanced technologies and products.
Based on the technical data and associated charts at the time this article was written, Stock Traders Daily has provided detailed trading plans, with integrated risk controls, to its clients. These plans will change in real time as prices move. To receive an update or to review the detailed trading plans associated with this data please review our Real Time Trading Report for XOM.
Technical Summary
| Term → | Near | Mid | Long |
|---|---|---|---|
| Rating | Strong | Neutral | Neutral |
| P1 | 74.50 | 64.21 | 70.45 |
| P2 | 75.88 | 71.19 | 79.19 |
| P3 | 77.44 | 77.86 | 87.79 |
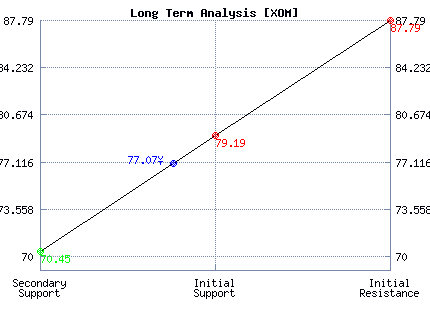
Support and Resistance Plot Chart for XOM
Long Term Trading Plans for XOM
April 11, 2018, 9:52 am ET
The technical Summary and associated Trading Plans for XOM listed below will help you make important timing decisions for your trades. This data is based on our proprietary analysis for XOM. In addition we offer Market Timing Models and Stock Filters in the links above which may increase the proficiency of the decisions you make.
XOM - (Long) Support Plan
Buy over 70.45 target 79.19 stop loss @ 70.19.
The technical summary data tells us to buy XOM near 70.45 with an upside target of 79.19. This data also tells us to set a stop loss @ 70.19 to protect against excessive loss in case the stock begins to move against the trade. 70.45 is the first level of support below 77.07 , and by rule, any test of support is a buy signal. In this case, support 70.45 would be being tested, so a buy signal would exist.
XOM - (Short) Resistance Plan
Short under 79.19 target 70.45 stop loss @ 79.45.
The technical summary data is suggesting a short of XOM as it gets near 79.19 with a downside target of 70.45. We should have a stop loss in place at 79.45 though. 79.19 is the first level of resistance above 77.07, and by rule, any test of resistance is a short signal. In this case, if resistance 79.19 is being tested, so a short signal would exist.


Blue = Current Price
Red= Resistance
Green = Support
Real Time Updates for Repeat Institutional Readers:
Factset: Request User/Pass
Bloomberg, Reuters, Refinitiv, Zacks, or IB users: Access Here.
Our Market Crash Leading Indicator is Evitar Corte.
Evitar Corte warned of market crash risk four times since 2000.
It identified the Internet Debacle before it happened.
It identified the Credit Crisis before it happened.
It identified the Corona Crash too.
See what Evitar Corte is Saying Now.
Get Notified When our Ratings Change: Take a Trial
