 pool ads
Will General Mills, Inc.’s (NYSE: GIS) Expensive Acquisition Pay Off?
General Mills, Inc. (NYSE: GIS) recently announced that it had acquired Blue Buffalo Pet Products Inc (NASDAQ: BUFF) as part of its diversification strategy. The acquisition is well-timed given the changing consumer preferences in the packaged goods industry, which has led to many companies operating in the industry recording slower growth.
Given the current trends in the packaged goods industry, it is quite challenging for companies operating in the industry to generate growth. This is the main reason why General Mills decided to acquire Blue Buffalo in efforts to generate growth for company shareholders albeit using an inorganic channel.
Review Our GIS Trading Plans Here.
Our combined analysis of General Mills indicates that the company’s earnings are expected to remain largely flat in the upcoming quarter, which is a major improvement when compared to previous trends. The company is set to report earnings later this month and most analysts expect it to report better earnings when compared to a similar period in the previous fiscal year.
The company’s quarterly growth metric is expected to dip in the upcoming quarter, while annual growth is expected to dip this year, and to rise next year, but this was before the recent acquisition. It is highly likely that the company will report better growth figures this year.
The pet food industry is growing at a steady rate driven by rising demand from millennials who are adopting pets at a faster rate than other demographics. Another important factor that could have influenced the acquisition decision by General Mills is the relative stability of the pet food industry.
The pet food industry is expected to grow at a compound annual growth rate of about 4% up to 2022, which will translate into growth for General Mills shareholders following the acquisition. The industry is also quite immune to negative economic conditions given that the industry did not contract during the financial crisis of 2008 and the ensuing recession.
Based on the technical data and associated charts at the time this article was written, Stock Traders Daily has provided detailed trading plans, with integrated risk controls, to its clients. These plans will change in real time as prices move. To receive an update or to review the detailed trading plans associated with this data please review our Real Time Trading Report for GIS.
Technical Summary
| Term → | Near | Mid | Long |
|---|---|---|---|
| Rating | Neutral | Weak | Neutral |
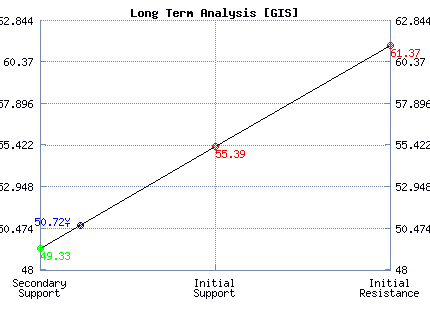
| P1 | 50.78 | 47.63 | 49.33 |
| P2 | 51.51 | 51.56 | 55.39 |
| P3 | 52.73 | 55.33 | 61.37 |
Support and Resistance Plot Chart for GIS
Long Term Trading Plans for GIS
March 19, 2018, 8:46 am ET
The technical Summary and associated Trading Plans for GIS listed below will help you make important timing decisions for your trades. This data is based on our proprietary analysis for GIS. In addition we offer Market Timing Models and Stock Filters in the links above which may increase the proficiency of the decisions you make.
GIS - (Long) Support Plan
Buy over 49.33 target 55.39 stop loss @ 49.07.
The technical summary data tells us to buy GIS near 49.33 with an upside target of 55.39. This data also tells us to set a stop loss @ 49.07 to protect against excessive loss in case the stock begins to move against the trade. 49.33 is the first level of support below 50.72 , and by rule, any test of support is a buy signal. In this case, support 49.33 would be being tested, so a buy signal would exist.
GIS - (Short) Resistance Plan
Short under 55.39 target 49.33 stop loss @ 55.65.
The technical summary data is suggesting a short of GIS as it gets near 55.39 with a downside target of 49.33. We should have a stop loss in place at 55.65 though. 55.39 is the first level of resistance above 50.72, and by rule, any test of resistance is a short signal. In this case, if resistance 55.39 is being tested, so a short signal would exist.


Blue = Current Price
Red= Resistance
Green = Support
Real Time Updates for Repeat Institutional Readers:
Factset: Request User/Pass
Bloomberg, Reuters, Refinitiv, Zacks, or IB users: Access Here.
Our Market Crash Leading Indicator is Evitar Corte.
Evitar Corte warned of market crash risk four times since 2000.
It identified the Internet Debacle before it happened.
It identified the Credit Crisis before it happened.
It identified the Corona Crash too.
See what Evitar Corte is Saying Now.
Get Notified When our Ratings Change: Take a Trial