Will QUALCOMM, Inc. (NASDAQ: QCOM) Thrive After the Failed Broadcom Bid?
It is evident that were it not for the excessive lobbying that QCOM’s management did in Washington outspending Broadcom by 100 to 1, shareholders would have voted in favor of the takeover. The main reason for this is because the chipmaker’s revenues have been declining since fiscal 2014 at an average annualized rate of 5% and the only reason why institutional investors are still holding the stock is largely due to its future growth prospects.
Review Our QCOM Trading Plans Here.
Our combined analysis of the company indicates that QCOM’s revenues increased slightly in Q3 and Q4 2017, but is set to decline in the upcoming quarter. Further technical analysis of the company indicates that its quarterly growth rate also improved in the two quarters, but is also set to decline in the next quarter. The company’s annual growth rate has been on a downtrend since Q2 2017 and this is expected to continue for the rest of the year.
However, it is our fundamental analysis of the company that is most interesting given that QCOM’s main growth opportunities all lie within China. Firstly, the company is in the last stages of acquiring NXP Semiconductors NV (NASDAQ: NXPI), but requires approval from Chinese regulators for the deal to go through.
The fact that QCOM expects Chinese regulators to approve its acquisition of NXP Semiconductors is ironic as they might scuttle the deal based on the same national security concerns cited by CFIUS. The second ironic development is that China is set to become the biggest market for 5G connected devices this year and in future, yet QCOM may be denied access to the Chinese market in retaliation to the Trump administration’s vetoing of numerous acquisition attempts by Chinese firms.
Based on the technical data and associated charts at the time this article was written, Stock Traders Daily has provided detailed trading plans, with integrated risk controls, to its clients. These plans will change in real time as prices move. To receive an update or to review the detailed trading plans associated with this data please review our Real Time Trading Report for QCOM.
Technical Summary
| Term → | Near | Mid | Long |
|---|---|---|---|
| Rating | Strong | Weak | Neutral |
| P1 | 53.93 | 49.99 | 53.96 |
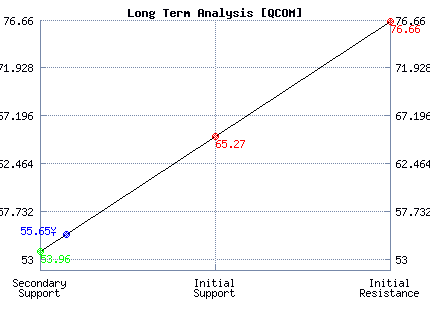
| P2 | 54.88 | 54.52 | 65.27 |
| P3 | 55.51 | 58.68 | 76.66 |
Support and Resistance Plot Chart for QCOM
Long Term Trading Plans for QCOM
April 13, 2018, 10:42 am ET
The technical Summary and associated Trading Plans for QCOM listed below will help you make important timing decisions for your trades. This data is based on our proprietary analysis for QCOM. In addition we offer Market Timing Models and Stock Filters in the links above which may increase the proficiency of the decisions you make.
QCOM - (Long) Support Plan
Buy over 53.96 target 65.27 stop loss @ 53.7.
The technical summary data tells us to buy QCOM near 53.96 with an upside target of 65.27. This data also tells us to set a stop loss @ 53.7 to protect against excessive loss in case the stock begins to move against the trade. 53.96 is the first level of support below 55.65 , and by rule, any test of support is a buy signal. In this case, support 53.96 would be being tested, so a buy signal would exist.
QCOM - (Short) Resistance Plan
Short under 65.27 target 53.96 stop loss @ 65.53.
The technical summary data is suggesting a short of QCOM as it gets near 65.27 with a downside target of 53.96. We should have a stop loss in place at 65.53 though. 65.27 is the first level of resistance above 55.65, and by rule, any test of resistance is a short signal. In this case, if resistance 65.27 is being tested, so a short signal would exist.


Blue = Current Price
Red = Resistance
Green = Support
Real Time Updates for Repeat Institutional Readers:
Factset: Request User/Pass
Bloomberg, Reuters, Refinitiv, Zacks, or IB users: Access Here.
Our Market Crash Leading Indicator is Evitar Corte.
Evitar Corte warned of market crash risk four times since 2000.
It identified the Internet Debacle before it happened.
It identified the Credit Crisis before it happened.
It identified the Corona Crash too.
See what Evitar Corte is Saying Now.
Get Notified When our Ratings Change: Take a Trial