 pool ads
Will United Parcel Service, Inc. (NYSE: UPS) Grow Despite Losing Amazon.com?
United Parcel Service, Inc. (NYSE: UPS) recently witnessed a massive correction in its stock price after Amazon.com, Inc. (NASDAQ: AMZN) announced that it was launching its own parcel delivery service. Given that the e-commerce giant is a major UPS customer it becomes clear why the stock sold-off as investors feared that losing Amazon as a client would adversely affect UPS.
However, we believe that UPS has solid fundamentals that will ensure the parcel delivery service remains profitable even after losing Amazon.com as a client. The company has several growth opportunities that are likely to drive future expansion while its financial metrics are also set to keep improving over the next three years.
Review Our UPS Trading Plans Here.
Our combined analysis of the company indicates that its revenues and earnings improved significantly in Q4 2017 as compared to the previous quarter. The increase in revenues and earnings can be attributed to the seasonally strong fourth quarter driven by the December holiday season, while Q1 is usually the weakest quarter.
The company’s quarterly growth rate also increased slightly in Q4, but could not be compared to the increase recorded in Q2 2017. The same trend was replicated in the company’s annual growth rate.
Through our fundamental analysis of UPS, we identified several existing growth opportunities that could fuel the company’s future growth. Firstly the air freight segment recorded significant growth in demand last year, which the company is well-positioned to capitalize on given that it has made significant investments in its air freight capacity.
Another major tailwind for the company is the recently passed tax reform bill, which will have a positive impact on the company’s bottom line this year. The company reported a cash benefit of $1.75 billion in fiscal 2017 at an effective tax rate of 35%, which implies a much bigger cash benefit this year given the lower corporate tax rate.
The company’s management is also predicting a 26-40% increase in free cash flow levels this year, which coupled with its high payout ratio could see investors being paid higher dividends.
Based on the technical data and associated charts at the time this article was written, Stock Traders Daily has provided detailed trading plans, with integrated risk controls, to its clients. These plans will change in real time as prices move. To receive an update or to review the detailed trading plans associated with this data please review our Real Time Trading Report for UPS.
Technical Summary
| Term → | Near | Mid | Long |
|---|---|---|---|
| Rating | Strong | Neutral | Neutral |
| P1 | 105.04 | 85.86 | 97.20 |
| P2 | 106.29 | 99.85 | 112.75 |
| P3 | 107.45 | 113.50 | 128.46 |
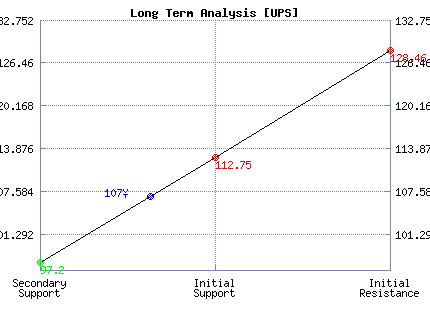
Support and Resistance Plot Chart for UPS
Long Term Trading Plans for UPS
April 13, 2018, 10:44 am ET
The technical Summary and associated Trading Plans for UPS listed below will help you make important timing decisions for your trades. This data is based on our proprietary analysis for UPS. In addition we offer Market Timing Models and Stock Filters in the links above which may increase the proficiency of the decisions you make.
UPS - (Long) Support Plan
Buy over 97.20 target 112.75 stop loss @ 96.94.
The technical summary data tells us to buy UPS near 97.20 with an upside target of 112.75. This data also tells us to set a stop loss @ 96.94 to protect against excessive loss in case the stock begins to move against the trade. 97.20 is the first level of support below 107 , and by rule, any test of support is a buy signal. In this case, support 97.20 would be being tested, so a buy signal would exist.
UPS - (Short) Resistance Plan
Short under 112.75 target 97.20 stop loss @ 113.01.
The technical summary data is suggesting a short of UPS as it gets near 112.75 with a downside target of 97.20. We should have a stop loss in place at 113.01 though. 112.75 is the first level of resistance above 107, and by rule, any test of resistance is a short signal. In this case, if resistance 112.75 is being tested, so a short signal would exist.


Blue = Current Price
Red= Resistance
Green = Support
Real Time Updates for Repeat Institutional Readers:
Factset: Request User/Pass
Bloomberg, Reuters, Refinitiv, Zacks, or IB users: Access Here.
Our Market Crash Leading Indicator is Evitar Corte.
Evitar Corte warned of market crash risk four times since 2000.
It identified the Internet Debacle before it happened.
It identified the Credit Crisis before it happened.
It identified the Corona Crash too.
See what Evitar Corte is Saying Now.
Get Notified When our Ratings Change: Take a Trial